- The XRP chart shows a tightening range, signaling an upcoming surge in price movement.
- Analyst highlights Bollinger band squeeze, warns of looming volatility in XRP market.
- Historical pattern suggests XRP may repeat strong breakout seen in late 2024.
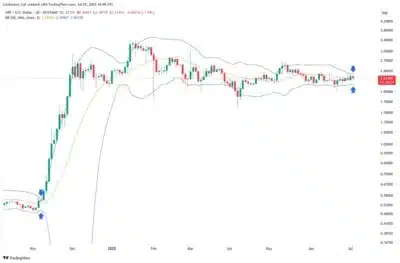
XRP is approaching a potentially major price shift as a key technical pattern tightens on its two-day chart. According to crypto analyst Cantonese Cat, the XRP/USD pair is now exhibiting a classic Bollinger band squeeze, a setup often followed by sharp price movement.
The analysis, shared on X, was based on Bitstamp data and featured Bollinger Bands set to a 20-period simple moving average with two standard deviations. Traders use this configuration broadly to determine the volatility in the market.
Also Read: Expert Shuts Down XRP Burn Rate Panic With Shocking 70,000-Year Supply Claim
In the chart, XRP consolidates around $2.21, and the Bollinger Bands shrink because of weeks of consolidation.
Arrows around the upper and lower bands indicate the degree to which price action has been compressed since early May. This chart also indicated a close squeeze towards the end of 2024, only before XRP made a huge increment.
The historical move gives background to the now-tightening range, and expectations are that another large-scale price movement will occur.
Cantonese Cat failed to give a particular direction of the breakout, but the arrangement suggests that volatility is starting to accumulate, and a decisive move may not be long off. The present price is close to the 20-period moving average, which has flattened on this interval of low momentum in the market.

Source: @cantonmeow
Tight Range Mirrors 2024 Breakout Pattern as Traders Watch for Signal
XRP’s price behavior in recent months has lacked direction, with much of 2025 spent in sideways trading. This comes after a strong rally that closed out 2024. Bands have remained low without any increase, and the circumstances seem set up with high expectations of a significant change.
Analysts and traders are now closely monitoring for any signs of a breakout beyond the current range. In the past, new trends have been formed upon periodic breaks above or below Bollinger Bands. Until that happens, the squeeze is an unbiased sign, biased in no direction.
The fact that XRP’s 2-day chart shows a Bollinger band squeeze has put the market on high alert.
As volatility builds, traders are bracing for what could become a massive price move once the breakout direction is confirmed.
Also Read: Shiba Inu Nears Rare Weekly Death Cross—Is a Major Crash Coming Next?
