Last updated on May 27th, 2024 at 08:05 am
The market has been setting off on the wrong foot for many weeks’ onset, yet ultimately radiates a silver lining. Assessing the chances of a long-term rally behind Bitcoin’s and Ethereum’s upswings
As Ethereum could be the closest ever to getting listed on Wall Street, a positive sentiment has been hovering in the market. With Bitcoin’s May 20 upsurge, it’s time to evaluate: is it an off-tendency action, or a sigh for long-term highs?
Will Bitcoin’s $70K hold for long?
Since Bitcoin reached its all-time high of $73,000 on March 14, it has indicated a global downward trend, which is absolutized to reaching a critical $56,792 bottom on May 1. The resistance point bounced back with a vague bullish sentiment, later rebounding and bringing BTC to the $60,796 range on May 9.
Amid fluctuating market conditions, Bitcoin recovered by over 4% on May 10, moving closer to $64,000. Upswung volatility had been in charge until BTC experienced a rapid 10% surge, which brought the cryptocurrency back to the $70,000 range.
This again brought the speculations about long-term BTC potential on the table, the boldest of ones citing the asset to overcome $220,000, as per Max Keiser – a vocal Bitcoin advocate and former financial journalist.
The forecast is driven by what Keiser identifies as a crucial dynamic in the market: a “demand shock meet supply shock” scenario, indicating a tightening of Bitcoin’s supply at a time of increasing demand.
Read Also: Ethereum Hits the Road to $4,000 Or Not? Spot Ethereum ETF Approval Possible Impact
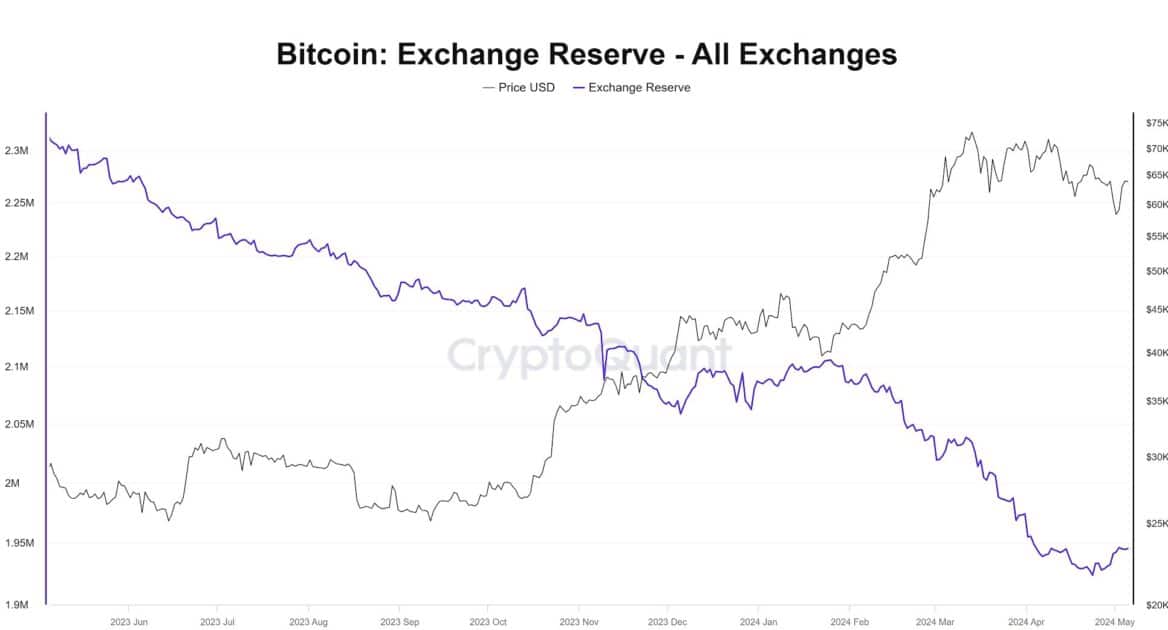
Bitcoin: Exchange Reverse rate. Source: X/Vivek | CryptoQuant
This supply contraction and growing demand form the basis for Keiser’s prediction of a “God candle” on Bitcoin charts – a dramatic price surge that could potentially elevate BTC to the $220,000 range.
Crucially, a closer look at Bitcoin’s daily chart reveals positive sentiment, evidenced by the relative strength index (RSI) at 57.77 rate and 50-day and 200-day exponential moving averages (EMA), marking the potential uptick.
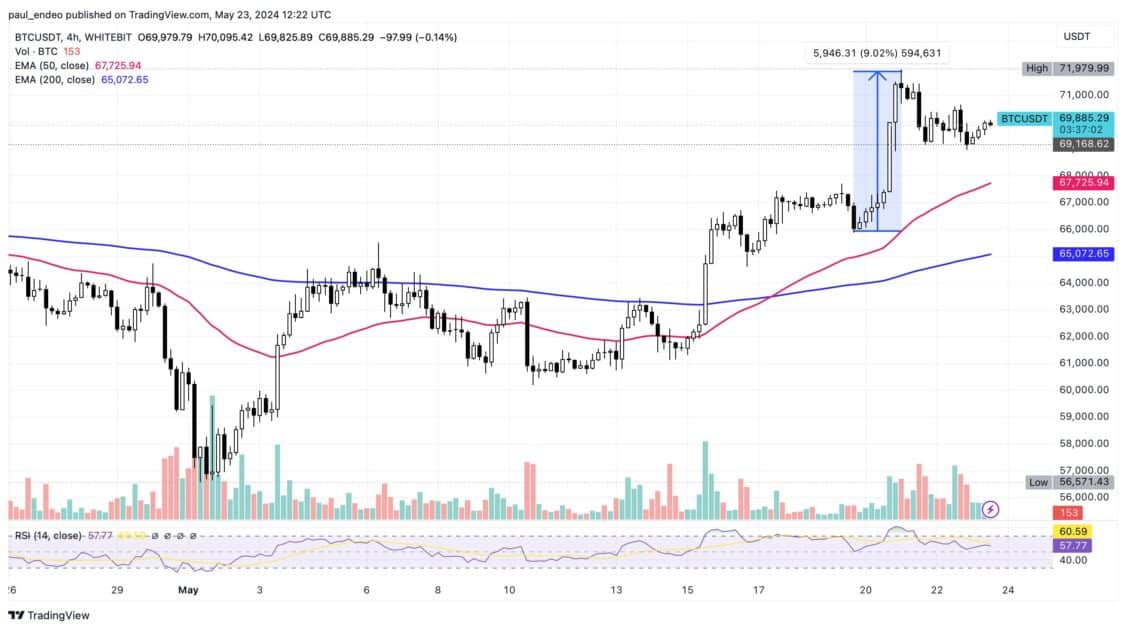
BTC/USDT 1D chart. Source: WhiteBIT Trading View
Notably, the chart indicates that Bitcoin has finally broken its structure to the downside over recent months, leading to liquidity accumulation at each structural break. By contrast, the possible bearish outlook is reflected in the number of active Bitcoin addresses and a slowdown in new address momentum.
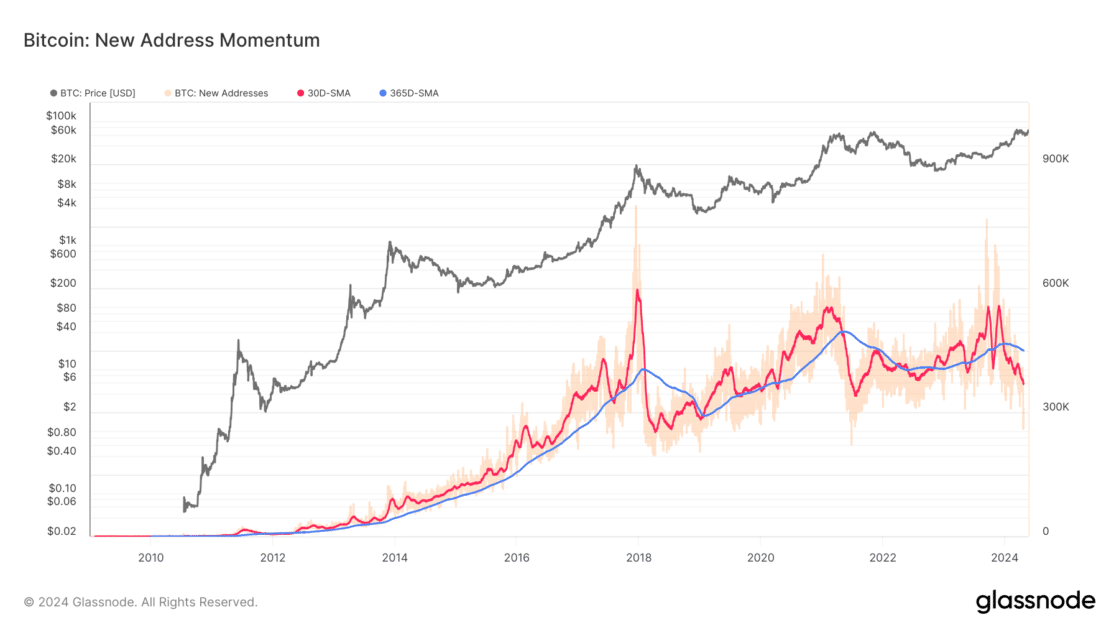
Bitcoin: new address momentum. Source: Glassnode
This indicates the market’s skepticism about a short-term bullish turnaround behind the recent correction phase.
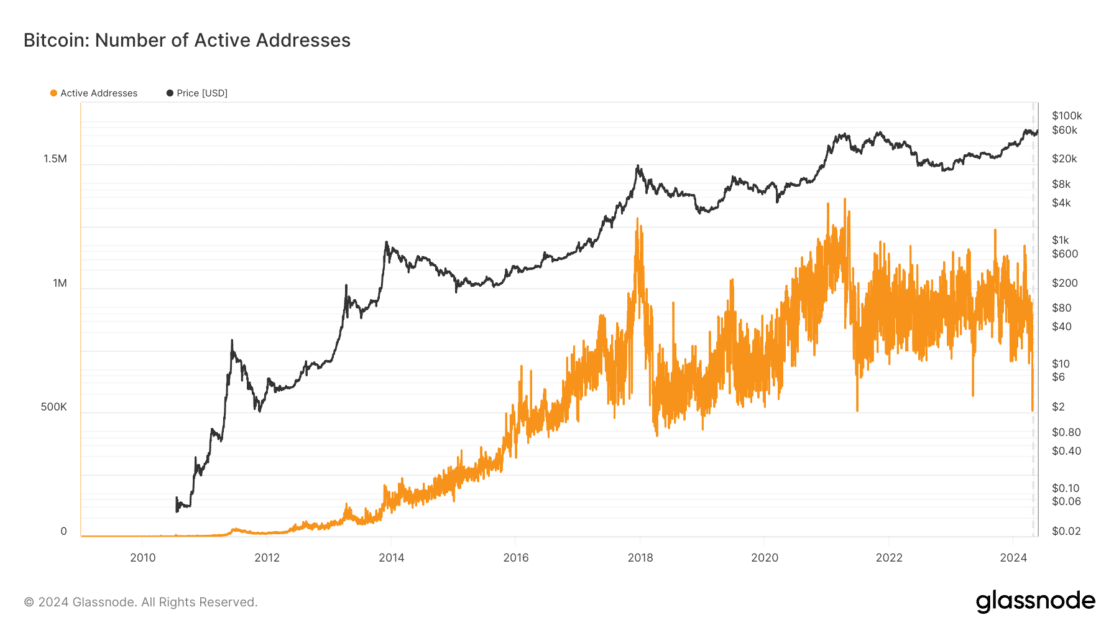
Bitcoin: number of active addresses. Source: Glassnode
Regardless, the long-term outlook for Bitcoin remains optimistic, as Santiment noted increased Bitcoin whales’ activity since May 8. This may be a silver lining for the first cryptocurrency and its holders.
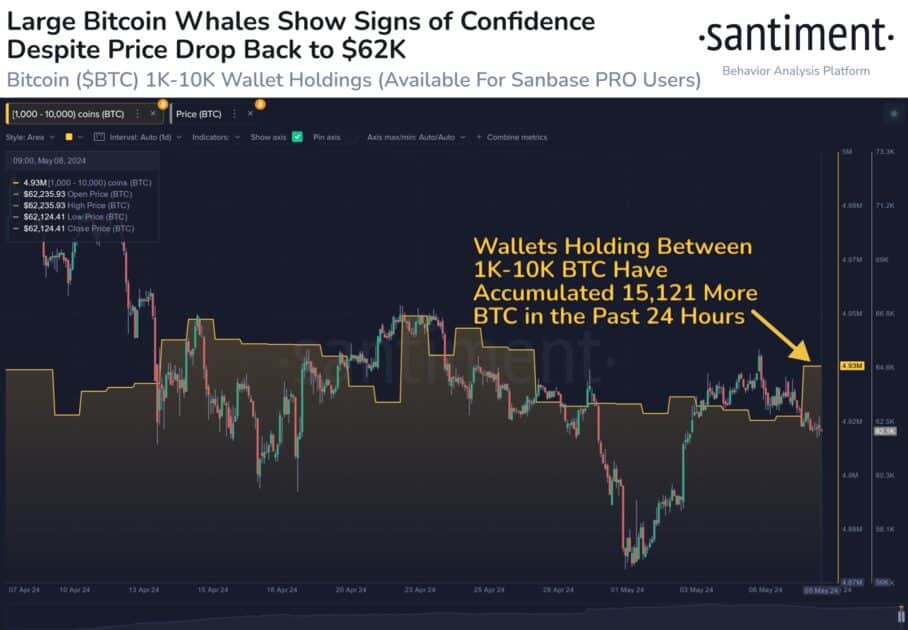
1,000-10,000 BTC wallet holders. Source: Santiment
Ethereum ETF At Its Closest – $4,000 Expected
After experiencing a severe price decline on the 7th of May, Ether (ETH) saw more liquidations in long positions. As a result of the shorting activity, the price of ETH went further south, falling below the $3,000 price range in momentum.
The fluctuation came amidst Grayscale’s abrupt withdrawal of its Ethereum futures ETF filing, which brought pessimistic signals to the market participants envisaging SEC’s potential next move.
Still, throughout May 20-May 23, Ether managed to break out of the bearish trend and hit the local milestone of $3935.37, marking a 29.22% growth. The bullish dynamic took up amidst the rumor of Ethereum ETF likable approval. Notably, Ether’s 4-hour chart suggests the long-term bullish perspective, as 50-, 100-, and 200-day exponential moving averages (EMA) register sharp upticks.
Read Also: SEC Contacts Companies Behind Ethereum ETF Regarding S-1 Forms
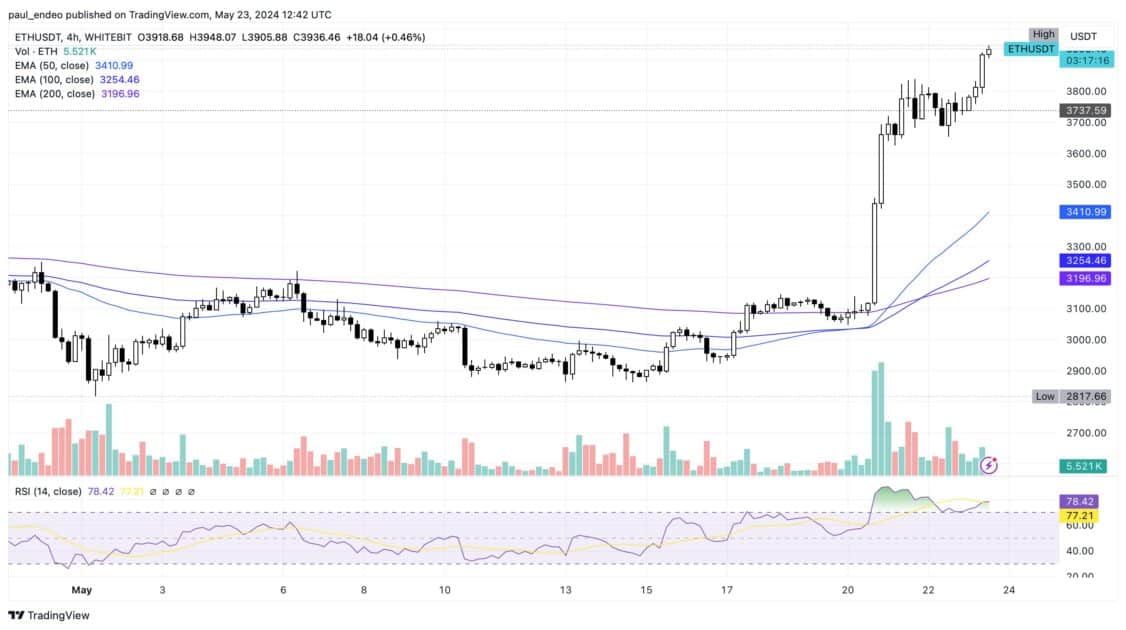
ETH/USDT 4h chart. Source: WhiteBIT Trading View
Daily timeframe price trend marks a notable three-day incline with a moderate level of volatility, depicted by the Bollinger Band. The incline has further entrenched Ether into a bullish trend, with the relative strength index (RSI) standing at 73.70, signaling a strong upward sentiment.
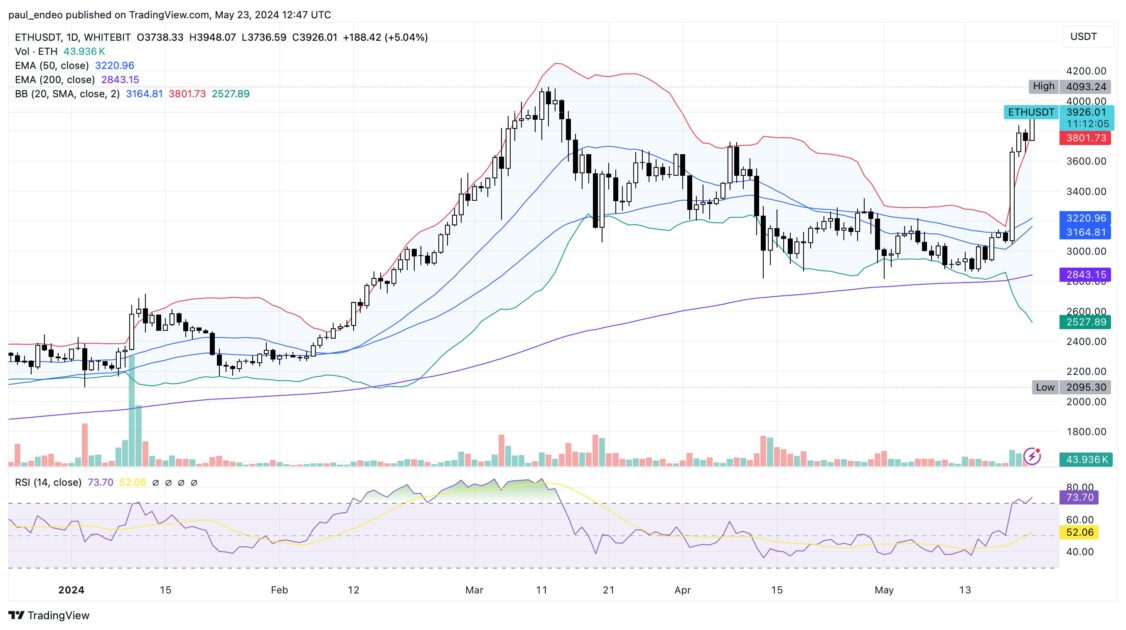
ETH/USDT 1D chart. Source: WhiteBIT Trading View
Altcoins Seek Second Breath
The altcoin market quickly followed the moves of the stronger Bitcoin and Ethereum. Almost every of the top 10 altcoins recorded an average 8%-10% increase in price. Namely, Cardano (ADA) registered a 5.68% growth, while Avalanche (AVAX) increased almost 15%, marking a local $15 milestone at the writing time.
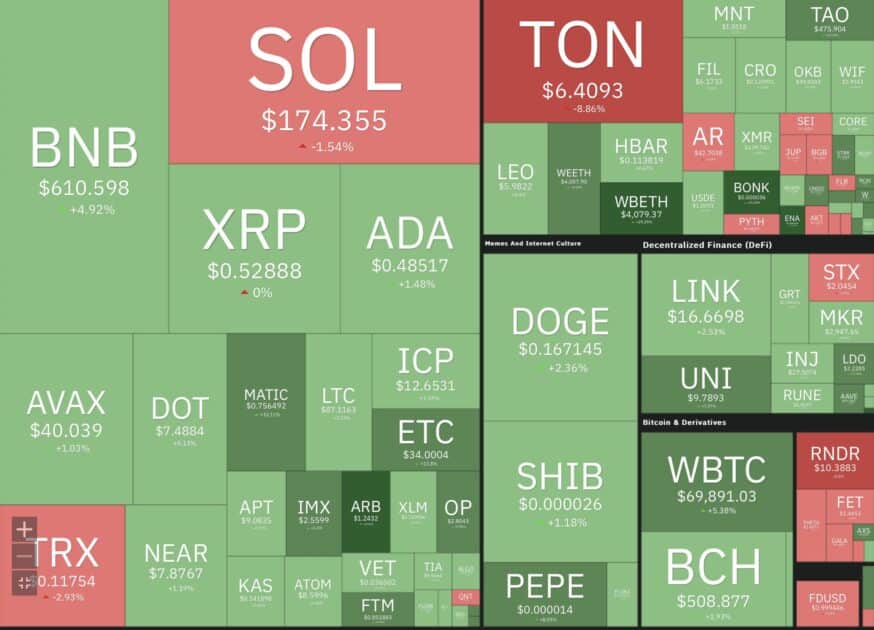
Altcoin market monitor. Source: COIN360
Notably, among the top performers, memecoins took the lead. After a post-GME rally consolidation, Pepe (PEPE) indicated a staggering 65.60% growth that took it to the all-time high (ATH) of $0.0000147.
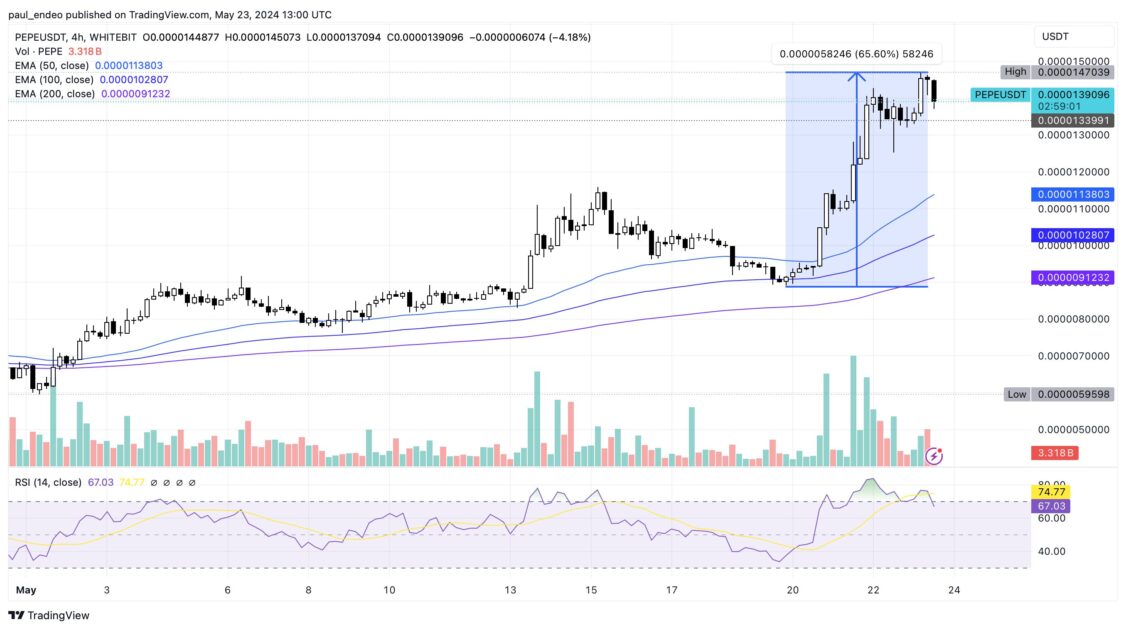
PEPE/USDT 4h chart. Source: WhiteBIT Trading View
Dogecoin (DOGE) also closed upon the elevation, achieving the local highs of $0.16-$0.17.
Read Also: Liquidations Hit Bulls Amidst Bitcoin and Altcoins Drop, Why is the Market Down?
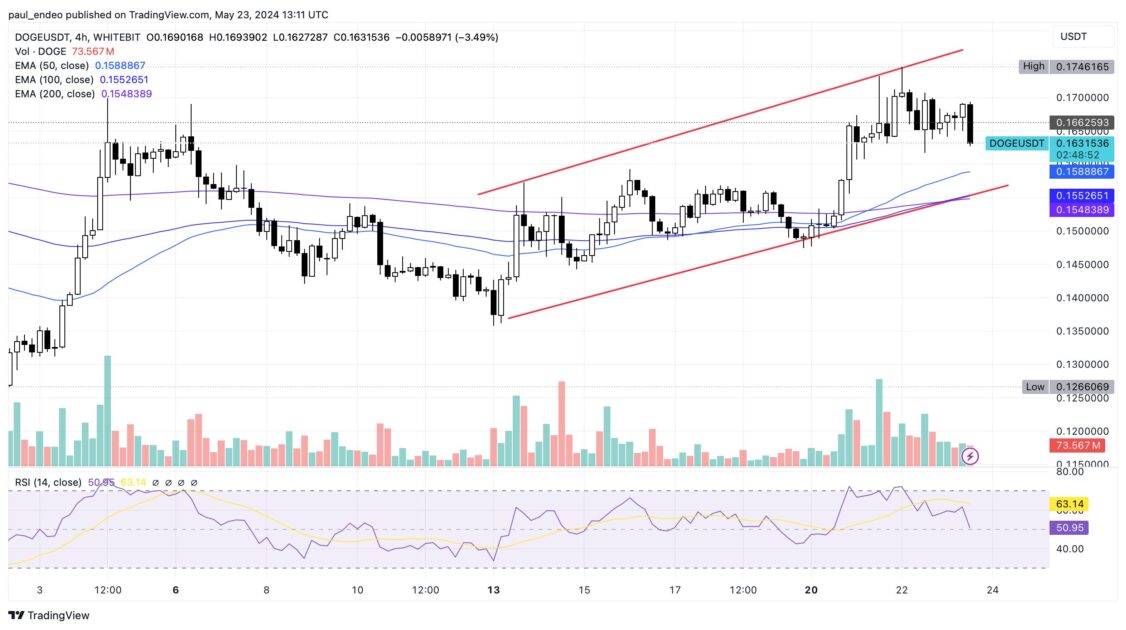
DOGE/USDT 4h chart. Source: WhiteBIT Trading View
Interestingly, Solana-based memecoins Dogwifhat (WIF) and Bonk (BONK) have also marked a price surge, by contrast to SOL, which went south due to the Ethereum ETF resonance. As the bulls took over the market, this tendency proved to be long-term – with the investment behavior set for durable optimism.
Read Also: Ethereum and XRP Analysis: Who Will Lead the Altcoins?
