

XRP’s price has experienced fluctuations, recently trading at $3.11, reflecting a 0.53% gain within a day. Market trends continue to shift, with key indicators suggesting bullish and bearish possibilities.
Bearish Signs Emerge as XRP Breaks Key Support Levels
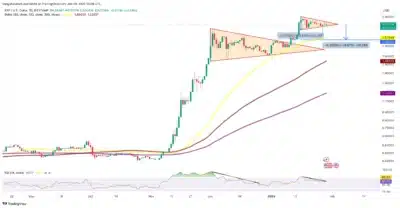
XRP exhibits signs of a potential downturn, as technical patterns indicate a breakdown from a symmetrical triangle formation. Historically, such patterns suggest that a breakout in either direction could set the stage for a significant price movement.
The cryptocurrency’s latest move indicates that bears are gaining control, with key indicators pointing toward a possible decline to the $2.50 support level.
Also Read: How High Can XRP Surge?
Source: TradingView
The symmetrical triangle pattern consists of converging trendlines connecting higher and lower highs, typically signaling a breakout. If XRP fails to maintain support near $3.00, the price could slide toward the 50-day exponential moving average (EMA) at $2.57.
A further drop to the lower target of $2.50 would mark an 18% decline from current price levels.
This downside target is calculated by measuring the maximum height of the triangle and subtracting it from the breakdown point near $3.00. Conversely, a strong upward breakout above $3.20 could fuel a rally toward $3.75, providing a bullish counterargument. However, current market conditions favor the bearish outlook.
Declining Active Addresses Indicate Selling Pressure
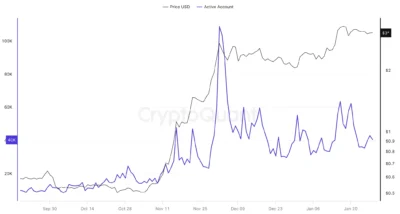
On-chain data reveals a significant decline in active XRP wallets, suggesting a reduction in buying interest. Active addresses fell sharply from 108,771 on December 2, 2024, to 40,292 by January 28. This represents a 39% decline in just over a month, aligning with a 10% drop in XRP’s price over the same period.
The decrease in active addresses implies that many holders have profited after XRP’s surge to its seven-year high of $3.40. If this trend persists, selling pressure could intensify, leading to further price declines before any potential recovery.
Also Read: See How Much XRP Ripple Co-Founder Has Dumped This Year
Source: CryptoQuant
Bullish Prospects Remain Despite Current Weakness
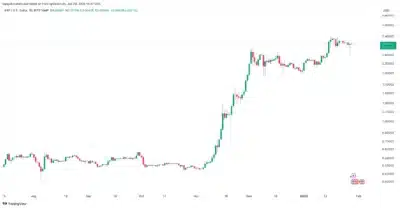
Despite the ongoing pullback, XRP trades within a bullish continuation pattern, known as a bull flag. This pattern indicates the possibility of a price rebound if crucial support levels hold. The formation emerged after XRP surged from $2.27 to $3.40 between January 10 and January 16.
XRP trades within a descending parallel channel, with key resistance around $3.30. A breakout above this level could trigger renewed bullish momentum. If XRP sustains upward movement, its bull flag target of $4.60 remains in play, representing a 52% increase from current levels.
Conclusion
XRP’s price remains volatile as market indicators fluctuate, with the symmetrical triangle breakdown suggesting a potential drop to $2.50 and declining active addresses highlighting reduced market participation.
However, the cryptocurrency’s recent trading at $3.11 and a possible bull flag breakout provide hope for recovery. Investors closely monitor price action as XRP navigates through critical technical levels in the coming days.
Also Read: Here is DeepSeek AI XRP Prediction For 2025
