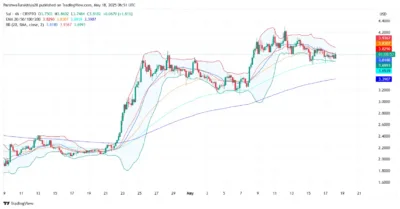
SUI is currently trading at $3.82, showing a slight 0.54 percent gain ahead of May 19. The token remains within a narrow consolidation range as traders await a decisive breakout.
Earlier this month, SUI surged above the $4.00 level before retracing. Since then, price action has stabilized between $3.66 and $3.85. These levels define the current range and determine the next directional move.
Also Read: Kava (KAVA) Price Prediction 2025–2029: Can Kava (KAVA) Hit $ 4.15 Soon?
Price Holds Key Support as Bulls Defend Range
$3.66 is being strongly supported by the uptrend that started in early May. Buying pressure in this site has allowed SUI to stay above previous lows despite resistance above.
Still, a key point for Bitcoin is the $3.85 level, as several denials demonstrate the significance of this resistance.
If the price rises above $3.86, new bullish momentum may begin, with targets set at $4.08 to $4.20, as these areas have previously turned resistance.
Momentum indicators are starting to move bullish. The RSI indicator at 4 hours stays at 55, which indicates accumulation. On the 30-minute chart, MACD is in bullish territory, and the green bars indicate that momentum is building.

Source: Tradingview
Technical Patterns Signal Potential Breakout Setup
Bollinger Bands on the 4-hour chart are narrowing, indicating a wider price move may occur. The fact that the 20-EMA and 100-EMA are near $3.81 makes a breakout more likely. Preserving this level may lead the SUI to jump higher.
A bullish crossover above the Ichimoku cloud represents a bullish trend on the short-term charts. Symmetry can be spotted in the chart on both long and short timeframes; look for the price to hit $3.86 before making a move.
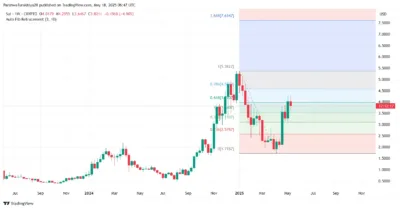
The Fibonacci retracement level still maintains support for the price at $3.71. Once the breakout happens, BCH/USD could move to the 0.786 extension near $4.55. If the buying pressure eases, the absence of $3.66 could see SUI fall to $3.20 or even lower to $2.90.
Conclusion
SUI enters May 19 poised near a critical resistance at $3.86. Price structure and technical indicators support a potential upward move, but confirmation is needed. A close above $3.86 could lead to further gains, while failure to hold $3.66 may trigger renewed selling.
SUI Key Technical Levels and Indicator Summary
| Indicator/Level | Value/Zone | Bias/Impact |
| Current Price | $3.82 | Neutral-Bullish |
| Immediate Resistance | $3.85–$3.86 | Key Breakout Zone |
| Target on Breakout | $4.08 – $4.20 | Upside Potential |
| Short-Term Support | $3.66 | Crucial Support |
| Breakdown Risk Level | $3.20 | Bearish Trigger |
| RSI (4H) | 55.73 | Mild Accumulation |
| MACD (30m) | Bullish Crossover | Early Momentum Shift |
| Bollinger Bands (4H) | Tightening | Imminent Volatility |
Also Read: XRP Crashes Below Key Levels as Death Cross Signals Bitcoin Takeover

