


SUI is currently trading at $3.82, showing a slight 0.54 percent gain ahead of May 19. The token remains within a narrow consolidation range as traders await a decisive breakout.
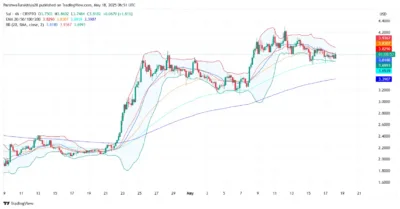
Earlier this month, SUI surged above the $4.00 level before retracing. Since then, price action has stabilized between $3.66 and $3.85. These levels define the current range and determine the next directional move.
Also Read: Kava (KAVA) Price Prediction 2025–2029: Can Kava (KAVA) Hit $ 4.15 Soon?
Price Holds Key Support as Bulls Defend Range
$3.66 is being strongly supported by the uptrend that started in early May. Buying pressure in this site has allowed SUI to stay above previous lows despite resistance above.
Still, a key point for Bitcoin is the $3.85 level, as several denials demonstrate the significance of this resistance.
If the price rises above $3.86, new bullish momentum may begin, with targets set at $4.08 to $4.20, as these areas have previously turned resistance.
Momentum indicators are starting to move bullish. The RSI indicator at 4 hours stays at 55, which indicates accumulation. On the 30-minute chart, MACD is in bullish territory, and the green bars indicate that momentum is building.
We're back on X.
— 36Crypto (@36Crypto1) August 21, 2026
Our previous account (36crypto2) is currently unavailable while we continue working through the appeal process. In the meantime, this is our new official account. While you are on this page, please support us by sharing and following.
Source: Tradingview
Technical Patterns Signal Potential Breakout Setup
Bollinger Bands on the 4-hour chart are narrowing, indicating a wider price move may occur. The fact that the 20-EMA and 100-EMA are near $3.81 makes a breakout more likely. Preserving this level may lead the SUI to jump higher.
Source: Tradingview
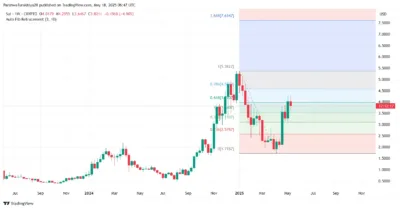
A bullish crossover above the Ichimoku cloud represents a bullish trend on the short-term charts. Symmetry can be spotted in the chart on both long and short timeframes; look for the price to hit $3.86 before making a move.
The Fibonacci retracement level still maintains support for the price at $3.71. Once the breakout happens, BCH/USD could move to the 0.786 extension near $4.55. If the buying pressure eases, the absence of $3.66 could see SUI fall to $3.20 or even lower to $2.90.
Conclusion
SUI enters May 19 poised near a critical resistance at $3.86. Price structure and technical indicators support a potential upward move, but confirmation is needed. A close above $3.86 could lead to further gains, while failure to hold $3.66 may trigger renewed selling.
SUI Key Technical Levels and Indicator Summary
| Indicator/Level | Value/Zone | Bias/Impact |
| Current Price | $3.82 | Neutral-Bullish |
| Immediate Resistance | $3.85–$3.86 | Key Breakout Zone |
| Target on Breakout | $4.08 – $4.20 | Upside Potential |
| Short-Term Support | $3.66 | Crucial Support |
| Breakdown Risk Level | $3.20 | Bearish Trigger |
| RSI (4H) | 55.73 | Mild Accumulation |
| MACD (30m) | Bullish Crossover | Early Momentum Shift |
| Bollinger Bands (4H) | Tightening | Imminent Volatility |
Also Read: XRP Crashes Below Key Levels as Death Cross Signals Bitcoin Takeover
