Bitcoin experienced intensified selling pressure over the past 24 hours, pushing its price down to around $104,020. The sharp drop, which amounts to a 1.6 percent decline, follows a failed attempt to hold above the 0.5 Fibonacci retracement level situated near $106,235.
This recent price action reflects a broader market correction that began after Bitcoin faced heavy rejection at the $110,000 resistance zone. Technical indicators across multiple timeframes now confirm a breakdown, with bearish momentum building and short-term upside attempts repeatedly failing.
Also Read: SUI Crashes Below Key Support as Bears Target $2.40 in Steep Selloff
Market Structure Breakdown Signals Bearish Continuation
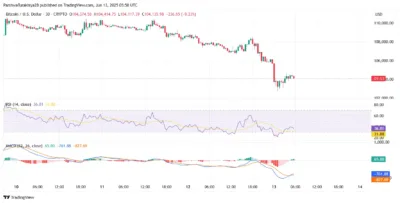
Bitcoin’s failure to defend its support zone between $105,000 and $104,500 on the 30-minute chart triggered a notable price drop. Following this breakdown, the asset retested the lower Bollinger Band near $104,000, confirming increased volatility and weakening support.
Momentum indicators are supporting the negative sentiment, with the Relative Strength Index declining to 36.8 and indicating that it is almost oversold. Simultaneously, the MACD histogram is still printing negative values, and there is no indication yet of a bullish crossover.

Source: Tradingview
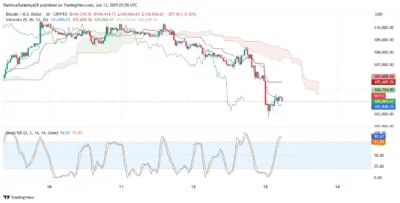
In the lower timeframe, the Ichimoku cloud chart is still in a bearish cloud, with the price action floating just below the Kumo cloud boundary. After an inconsequential rebound earlier in the day, Bitcoin has failed to demonstrate any significant follow-through, reflecting a reserved attitude of the market.

Source: Tradingview
Key Mid-Term Support Levels Under Threat as Downtrend Persists
On the 4-hour chart, Bitcoin has broken below an ascending wedge pattern that had underpinned its recent uptrend. It now trades well below the 20, 50, and 100 exponential moving averages, which have all converged around the $106,000 to $107,000 range and now serve as resistance.

Source: Tradingview
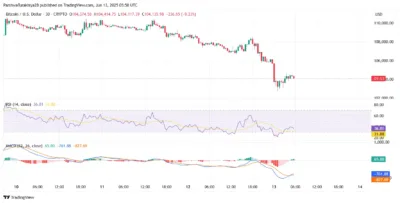
On the 4-hour chart, Bollinger Bands indicate expanding volatility in the downward-trending asset. The MACD is very much bearish, and there is no sign of a trend reversal yet.
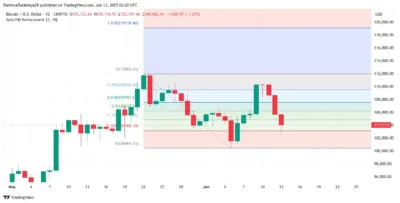
In the daily chart, Bitcoin is back at the 0.236 Fibonacci retracement level at $103,188, which is a key support area. A breakdown of this level would see a retest of the psychological support area at around $100,000, which coincides with a key rising trendline taken off the April breakout.

Source: Tradingview
As long as the bulls can hold the $103,200 support, short-term relief is sustainable, with resistance provided by the lower limit of the Ichimoku cloud around $105,600. Nevertheless, any upside effort can be capped until Bitcoin regains the $107,500 zone, where several moving averages are coinciding at the moment.
Bitcoin continues to face intense downside pressure as broader market sentiment weakens and technical indicators tilt in favour of the bears. A failure to maintain support at the current levels could accelerate a move toward the $100,000 mark. With resistance now layered across $106,000 to $107,500, the path to recovery remains uncertain unless bullish momentum returns swiftly.
Also Read: Analyst Calls XRP Investors’ Attention to Potential Imminent Major Price Movement
