Solana is showing signs of consolidation around the $149 mark following a brief dip to the $144 support zone. The digital asset managed to reclaim momentum after recovering from an earlier slide that pushed it away from recent highs near $156.
A short-term rebound has been observed from the $145 range, aligning with the confluence of trendline support and critical moving averages. Sellers are keeping a close eye on price movement around the level of 149- 152, where the ceiling is held by overlapping option data and technical ceilings.
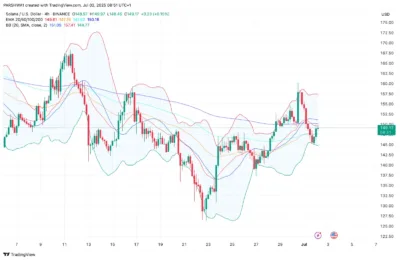
Looking at the 4-hour chart, Solana has been keeping the two indicators of EMA 20, 50, and 100, as well as EMA 200 points, as support at $150.18, although it is still seen as a short-term resistance. As observed currently, the structure showed a bullish breakout of the flag, which has been corrected and is now testing essential support areas.
Source: Tradingview
Also Read: Valhil Model Predicts XRP May Surge to $9,000 as Global Use Expands
Liquidity Patterns Suggest Short-Term Accumulation Phase
A break of structure near $146.50 and a change of character near $150 confirm ongoing short-term recovery. Liquidity data shows price reclaiming previously lost levels below $147 while pushing into an order block between $150 and $154.
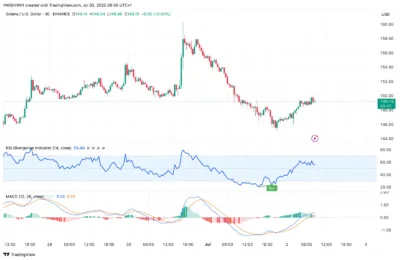
Momentum indicators are beginning to shift, as the 30-minute chart shows RSI bouncing from hidden bullish divergence at $145 and now standing at 56.48. This reflects a moderate increase in bullish pressure.
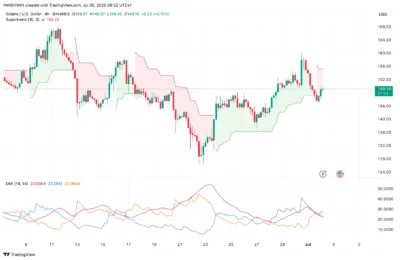
Holding steady to a higher curve, MACD indicators have confirmed a new bullish cross while the histogram bars continue to expand. The Supertrend, in the meantime, is still bullish on the 4-hour chart and hopeful above 145. The Parabolic SAR dots also portray bullish conditions in that support is now lagging the price action.
Source: Tradingview
Options Data Signals Possible Resistance Ahead
Despite the bullish technical signals, directional strength remains weak, with ADX levels still subdued. The DMI shows +DI above -DI, but the strength of the trend lacks strong confirmation.
Source: Tradingview
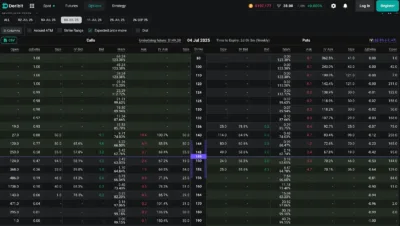
The activity in the options market can also explain the current hesitation. Data collected by Deribit indicates a concentration of open interest in the July 4 expiry at strike prices of 152 and 155. This placement restrains near-term optimistic gains as traders anticipate probable opposition in that area.
Source: Tradingview
Bollinger bands are starting to expand, implying that a breakout period is looming. Solana is slightly reaching toward the upper band at approximately $151.09, meaning that a breakout of this price may stimulate further prices. Price has similarly come back to the degree of VWAP at the rate of 149, revealing that the market is in equilibrium.
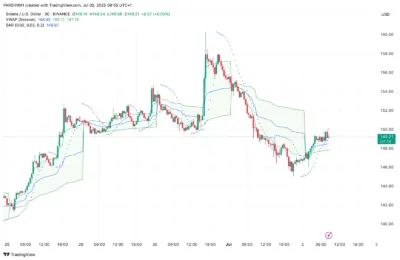
Source; Tradingview
In the larger scheme of things, on a lower time frame, Solana will be trading below a significant descending trendline that will cut across at the point of about $160. The next stage higher still needs to see a definite break decisively above $155-160, with the assistance of volume.
Solana’s price is currently navigating a key consolidation zone between $147 and $151. While short-term signals lean bullish, a sustained breakout depends on volume and broader market participation. Without that confirmation, the asset may revisit the lower end of its recent range.
Also Read: Here’s Why XRP Spot ETFs Could Be One Step Away From SEC Approval
