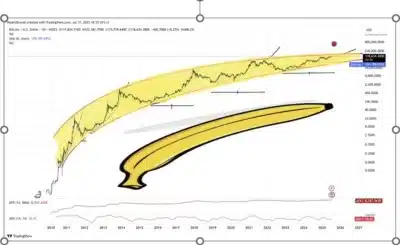
- Peter Brandt’s chart hints at Bitcoin’s next major breakout.
- Bitcoin’s 15-year arc signals critical move is fast approaching.
- Market divided as Bitcoin tests long-standing technical price curve.
A newly shared Bitcoin chart by veteran trader Peter Brandt is stirring major discussions across the crypto space. The 15-year log-scale chart, shaped like a curved arc, has drawn attention for signaling that Bitcoin may be on the verge of a significant price shift.
According to Brandt, the chart captures Bitcoin’s journey from its early days in 2010 to the current phase of compressed movement. The banana-shaped price graph begins at the point of Bitcoin’s discovery and slopes up towards its current price stability at around $118,000.
The chart does not make predictions or forecasts, but the message is clear that the most significant directional move may soon occur.
Brandt headed the post in style with the words, “What side of the Banana Split?” This point has been plainly perceived to mean two probable outcomes.
Bitcoin can either push its way above the top line and the long-term breakout pattern, or it will sink below the curve and mark the loss of the pattern that supported the asset over several cycles.

Source: Peter Brandt
Also Read: U.S. House Passes GENIUS Act to Regulate Stablecoins, Sends Bill to Trump
Market Divided as Bitcoin Tests Long-Term Technical Boundary
The chart arrives during a period of growing uncertainty in the market. While some investors remain optimistic due to institutional inflows and ETF momentum, others have turned cautious amid Bitcoin’s prolonged sideways trading.
The unresponsiveness of the price has raised partial anticipation on the direction of the next step.
Technical analysts are observing the curve in the chart closely, as it has withstood various movements during both bull and bear cycles. Bitcoin is struggling on the upper side of the price action, and there is a buildup that something will give in.
The breakout beyond the arc might signify a change in the multi-year technical story of Bitcoin.
Supported by Brandt’s strong reputation in long-range technical analysis and his direct approach, the post has gained added significance. Without offering forecasts, he has sparked critical thinking within the community by highlighting a structure that may not hold much longer.
Conclusion
Bitcoin’s price action is approaching a breaking point, as suggested by Peter Brandt’s striking “banana” chart. Whether the curve holds or splits will likely define the asset’s next significant move.
Also Read: Ripple Co-Founder Transfers $26M in XRP to Coinbase as Price Peaks

