- PENGU consolidates after explosive July breakout
- Price compression points to a decisive move as volatility drops
- On-chain outflows and key resistance zones challenge further upside
Pudgy Penguins (PENGU) has cooled off after a sharp upside run earlier this month, where it surged from below $0.020 to nearly $0.035. The token is now trading at $0.0316, consolidating in a low-volatility range that has formed a symmetrical triangle pattern on lower timeframes.
This setup reflects a market pause after a major impulse move, with traders awaiting confirmation of the next direction.
Despite the bullish macro trend, PENGU has struggled to break through the $0.0335–$0.035 resistance zone. Momentum indicators are showing signs of exhaustion, while on-chain data reveals a lack of fresh inflows — suggesting that profit-taking may be capping short-term gains.
With price nearing the apex of the triangle, a breakout or breakdown is likely imminent.
Also Read: XRP Price Rally Strengthens as On-Chain Activity Surges Past $1 Billion in Transfers
Technical Analysis
Symmetrical Triangle Structure Signals Consolidation Phase
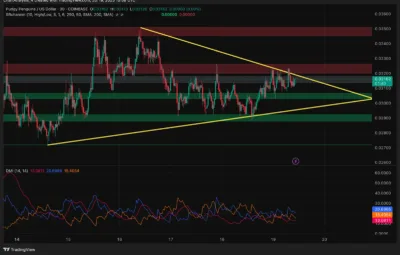
PENGU is currently forming a symmetrical triangle pattern, bounded by support at $0.0305 and resistance at $0.0328. This pattern has been developing on the 4-hour and 30-minute charts, reflecting a tightening price range and declining volatility.
The triangle follows a strong bullish impulse earlier in July and typically indicates a continuation or reversal depending on how the market resolves the compression.
As price approaches the apex of this formation, traders are closely monitoring for a breakout above resistance or a breakdown below support. A close above $0.0328 could open the door to $0.0355, with further upside possible toward $0.038 if momentum strengthens.
On the other hand, a breakdown below $0.0305 could lead to a pullback to $0.0282 or even $0.0246, both of which served as key demand zones in earlier trading.
Momentum Indicators Show Weak Trend Strength
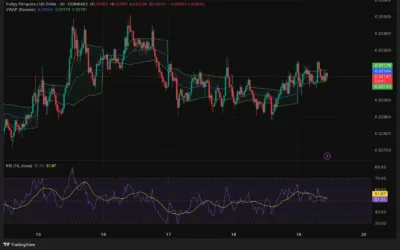
Technical indicators suggest that market momentum has faded following the earlier rally. The Relative Strength Index (RSI) on the 30-minute chart is hovering around 51.3 — a neutral reading that implies neither buyers nor sellers currently have the upper hand.
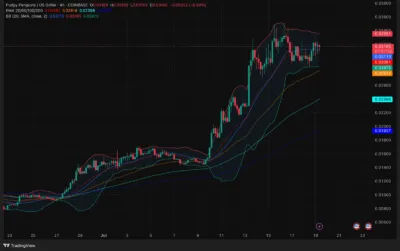
Meanwhile, the Bollinger Bands on the 4-hour timeframe are narrowing, signaling a classic volatility squeeze. This often precedes a significant price expansion, but the direction remains uncertain.

Source: Tradingview
The Directional Movement Index (DMI) further confirms the lack of trend strength. The Average Directional Index (ADX) has dropped below 20, and the +DI and -DI lines continue to crisscross.
This lack of directional clarity suggests a waiting game is in play, with bulls and bears each waiting for confirmation before committing.
Key Resistance Levels Continue to Cap Upside
Price action has struggled to break above the $0.0335 level, which has now become a critical overhead supply zone.
PENGU has made multiple attempts to reclaim this area, including sweeping liquidity around $0.034 to $0.035, but has failed to sustain a breakout. This pattern is often seen in distribution phases, where large players offload their positions during rallies.
The rejection at these highs reflects a broader market hesitation and implies that a clean break above $0.0335 will be needed for bulls to regain control.
Daily Indicators Point to Short-Term Exhaustion
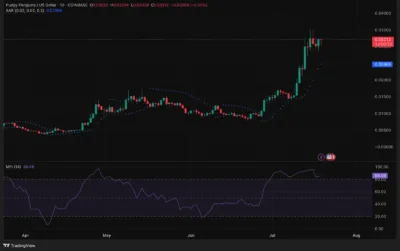
Additional warning signs have emerged on the daily chart. The Money Flow Index (MFI) currently reads 86.08, which is well into overbought territory. Historically, MFI levels above 80 tend to precede pullbacks or at least periods of sideways consolidation.
The Parabolic SAR has also flipped bearish, with the indicator now showing dots above the price on the daily chart. This shift confirms a short-term bearish bias and underscores the risk of further downside if momentum doesn’t return soon.
EMA Alignment Suggests Macro Trend Still Intact
Despite the signs of short-term weakness, the larger trend structure remains bullish. On the 4-hour timeframe, PENGU continues to trade above its exponential moving averages, which are aligned in a bullish configuration.
The EMA20 and EMA50 are currently positioned at $0.0308 and $0.0281 respectively, both rising and offering dynamic support should price test lower levels.
Moreover, the price remains comfortably above the 200 EMA on higher timeframes, indicating that the broader trend is still favorable for bulls — assuming critical support at $0.0305 holds.

Source: Tradingview
On-Chain Analysis
While technical support remains solid, the on-chain data raises concerns. According to Coinglass, PENGU saw a significant net spot outflow of $2.89 million on July 19.
This negative flow suggests that recent buyers are either taking profits or reallocating funds elsewhere, reducing the likelihood of immediate follow-through on the recent rally.
Without fresh capital entering the market, resistance levels are likely to hold firm in the short term.
The lack of sustained inflows also aligns with the price’s repeated failures to hold above $0.034, reinforcing the view that distribution is occurring near the highs.
Pudgy Penguins Price Forecast 2025–2030
| Year | Low ($) | Mean ($) | High ($) |
| 2025 | 0.026 | 0.032 | 0.038 |
| 2026 | 0.030 | 0.040 | 0.050 |
| 2027 | 0.035 | 0.055 | 0.065 |
| 2028 | 0.045 | 0.070 | 0.085 |
| 2029 | 0.060 | 0.095 | 0.120 |
| 2030 | 0.080 | 0.130 | 0.160 |
Year-by-Year Outlook
2025
PENGU is currently at a decision point, with a symmetrical triangle pattern dictating the next move. A breakout above $0.0328 and a reclaim of $0.0335 could send the price toward $0.0355 and $0.038. If support at $0.0305 fails, a slide to $0.028 or $0.026 becomes likely. Maintaining price above $0.030 will be crucial for sustaining the broader uptrend.
2026
Assuming renewed retail and institutional interest in meme tokens and NFT-linked assets, PENGU could rise toward $0.050. A consolidation phase between $0.035 and $0.045 is expected, with $0.040 serving as a midpoint and likely support.
2027–2028
As Pudgy Penguins deepens its presence in the Web3 space through games, collectibles, or social media integrations, prices could range between $0.065 and $0.085. Widespread adoption and utility upgrades will be key drivers in this period.
2029–2030
By the end of the decade, broader ecosystem expansion and token utility could help PENGU push into triple digits in cents. If successful, the token could reach highs between $0.130 and $0.160, driven by cultural relevance and cross-platform brand integration.
Conclusion
Pudgy Penguins is showing all the signs of a maturing asset transitioning from hype-driven volatility to technically structured trading. The current symmetrical triangle suggests a breakout is near, but low momentum, overbought indicators, and net outflows are temporarily suppressing upward progress.
A decisive move above $0.0328, with strong volume, will likely pave the way to $0.0355 and higher targets. However, failure to defend $0.0305 could trigger a pullback toward $0.028 or lower. For now, PENGU remains technically bullish on higher timeframes, but short-term caution is warranted.
FAQs
1. Is Pudgy Penguins currently bullish?
Yes, on higher timeframes. However, short-term indicators suggest a neutral or slightly bearish bias until price breaks resistance.
2. What is the next major resistance zone?
$0.0328 is the key breakout level. Above that, $0.0355 and $0.038 become the next upside targets.
3. Where is the strongest support?
Support sits at $0.0305, followed by deeper levels at $0.0280 and $0.0246.
4. Can PENGU reach $0.035 this year?
Yes, if the triangle breaks to the upside and buyers reclaim $0.0335 with momentum, $0.035 is within reach.
5. What’s driving PENGU’s consolidation phase?
Weak trend momentum, on-chain net outflows, and repeated rejections at key resistance levels are keeping the price in a tight range.
Also Read: Expert Reveals XRP’s Real Supply—Over 85% Locked or Lost


