- HBAR rebounds from June lows with bullish double bottom breakout
- Strong volume inflows and tightening Bollinger Bands support a breakout setup
- Weekly Fibonacci resistance near $0.296 is the next key level to watch
Hedera (HBAR) has made a sharp recovery from its June lows, forming a textbook double bottom pattern and reclaiming bullish structure. The price now hovers just below key resistance at $0.271 as traders await a breakout confirmation that could open the path to $0.296 and beyond.
HBAR has gained investor attention following a series of bullish structure confirmations and a notable surge in on-chain inflows. As of now, the technical and volume signals are aligning for a potential upside breakout.
Also Read: Floki (FLOKI) Price Prediction 2025–2030: Will FLOKI Hit $0.000016 Soon?
Technical Breakout Confirms Long-Term Pattern
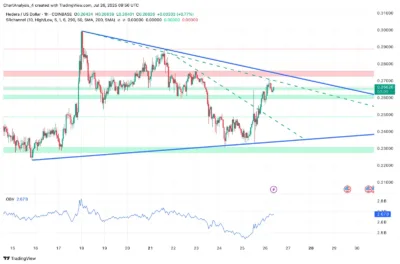
HBAR is trading at around the $0.267 price point after it recovered well off the seven-week low of $0.25 reached in May and held firm during early July. By breaking the neckline of the double bottom, the price has successfully retested the level and is currently in the process of coiling in a tightening wedge.
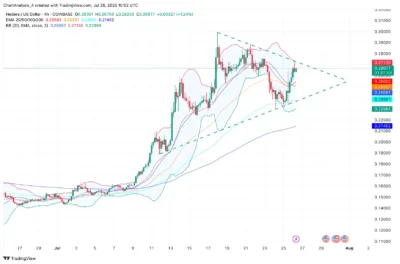
In the 4-hour chart, HBAR maintains all the significant short-term EMAs, specifically the 20, 50, and 100 EMAs, at the current values of $0.38, $0.348, and $0.307, respectively. At this point, the 100 EMA has also turned into dynamic support at the current price of $0.238. The Bollinger Bands are squeezing just around the mark of 27 cents, pointing to low volatility before a possible extension.
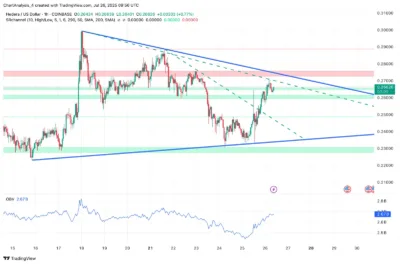
Regarding structure, HBAR is now stuck in the $0.29 resistance area, under printing highs. The rising On-Balance-Volume (OBV) is very much underdone by the accumulation.
Source: Tradingview
Momentum and Market Structure Support Upside
Positive net inflows also support the bullish trend into HBAR. According to Coinglass, the net spot inflow recorded a net value of $2.44 million on July 26th, one of the largest single-day inflows since March.

Source: Coinglass
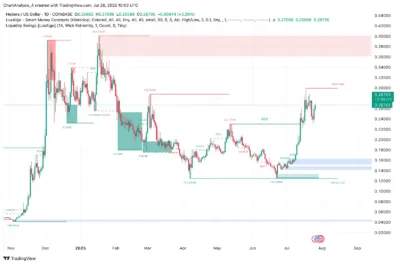
This burst in capital was accompanied by a bounce-up from 0.25, confirming the power of the movement. According to Smart Money Concept, there are several break-of-structure (BOS) prints in July, the latest in the range of $0.22.
Since then, a bearish change of character (CHoCH) has not occurred, so there are augmented bullish conditions. Currently, the value is grinding below the 0.618 Fibonacci level at 0.2959, which is significant weekly resistance. Provided that it is cleared, the Fibonacci target will be reached at $0.3421 (Fib 0.786).
Source: Tradingview
EMA Cluster and Bollinger Bands Set Up a Breakout
The four EMAs on the 4-hour chart—20, 50, 100, and 200—are currently arranged properly in bullish formation. The 200 EMA is positioned far below the current price of $0.2145, giving a sound idea of a bullish base.
Bollinger Bands that widened fairly recently are now shrinking once again towards the mark of $0.2713. The price bar is fighting with the upper band while displaying a consistent group of higher lows.
Source: Tradingview
This type of compression with increases in bottoms usually leads to attempts to break out. Both the 30-minute and 4-hour chart RSIs are sitting in the vicinity of 63.5, indicating the possibility of gaining momentum but not quite at the overbought levels.
The price is still above the bullish line at an oversold range, and as long as this is maintained, the bulls will dominate the trend.
On-Chain Accumulation and Structure Remain Bullish
The OBV is still in a positive trend, which means buyers are still active even when the stock is forming a stand. This balconing would increase the credence of the bullish breakout thesis.
Pattern confirmation, increasing volume, and spot inflows accumulating all offer indication that there should be at least a thrust higher. Nevertheless, failure to surpass the $0.271 mark with conviction may result in a fresh decline to around the $0.25 point.
In that situation, as well, the area of concern will be the zone between the price of $0.238 and the price of $0.250. As long as this area continues, the long-term bullish formation will remain intact.
Source: Tradingview
HBAR Price Forecast 2025–2030
| Year | Low ($) | Average ($) | High ($) |
| 2025 | 0.238 | 0.295 | 0.342 |
| 2026 | 0.270 | 0.340 | 0.410 |
| 2027 | 0.320 | 0.420 | 0.520 |
| 2028 | 0.390 | 0.500 | 0.630 |
| 2029 | 0.430 | 0.590 | 0.740 |
| 2030 | 0.500 | 0.680 | 0.800 |
Year-by-Year Outlook
2025
HBAR is approaching the neckline resistance at $0.271 with strong support at $0.250. A breakout could lead to $0.296 or even $0.342, while holding above $0.238 is key to maintaining structure.
2026
If the bullish setup continues and network adoption grows, HBAR could average around $0.340. A strong rally may lift the price closer to $0.410.
2027–2028
Assuming ecosystem growth and continued smart contract utility, HBAR could reach $0.520–$0.630. This would depend on broader crypto market conditions and real-world use cases.
2029–2030
If Hedera sees enterprise adoption at scale, price targets between $0.740 and $0.800 become realistic. However, this long-term growth will require continuous ecosystem development and global integration.
Conclusion
HBAR has rebounded strongly from June’s lows, forming a bullish double bottom and holding above key support. A $2.44M inflow has supported the recent price move, building momentum ahead of a potential breakout.
All major EMAs are aligned bullish, Bollinger Bands are tightening, and RSI is trending higher without entering overbought territory. The key resistance sits at $0.271, with upside targets at $0.296 and $0.342 if the breakout is confirmed.
As long as HBAR stays above $0.250, the bullish outlook remains intact heading into the second half of 2025.
FAQs
1. Is HBAR currently bullish?
Yes. HBAR has confirmed a double bottom breakout and remains above all major support zones.
2. What is the next key resistance zone?
$0.271 is immediate resistance, followed by $0.296 and $0.342 on the weekly Fibonacci scale.
3. Where is the strongest support?
Support lies at $0.250, with deeper support at $0.238.
4. Can HBAR reach $0.34 this year?
If it breaks above $0.271 with volume, a move to $0.342 is very possible in 2025.
5. What’s driving HBAR’s rally?
A confirmed bullish pattern, rising OBV, strong spot inflows, and positive technical alignment are powering the move.
Also Read: XRP Rebounds Sharply After $105M Wipeout, Bulls Now Target $4 Breakout
