


- FLOKI nears critical neckline after bullish breakout
- Cup and handle structure supports long-term uptrend continuation
- Investors monitor inflows and volume as the decision zone tightens
Floki (FLOKI) is approaching a crucial resistance after recovering from a steep correction earlier this week. The token is now trading around $0.00001325, attempting to reclaim bullish momentum following a breakdown from its rising channel.
Although the short-term weakness is still present, the overall structure is constructive. The daily chart still shows a cup-and-handle pattern, which offers a technical foundation for a possible continuation rally.
The pattern neckline is close to the price of $0.00001375, and a breakout of the line might take the price of FLOKI toward $0.00001550. Later, it might range at $0.00001658. Nevertheless, it is awaiting the market with more powerful inflows to validate the direction.
Also Read: XRP Rebounds Sharply After $105M Wipeout, Bulls Now Target $4 Breakout
Technical Breakout Confirms Long-Term Pattern
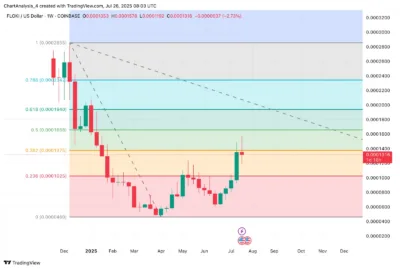
In March 2025, FLOKI was in a rounded bottom, which signified an accumulation phase. This past month, the price broke this base, confirming the inception of a new bullish period.
Having hit $0.00001550, the price swung back down, falling out of its upper rising trendline at the end of July. It has been supported at around $0.00001200 and moved back to more than $0.00001300.
We're back on X.
— 36Crypto (@36Crypto1) August 21, 2026
Our previous account (36crypto2) is currently unavailable while we continue working through the appeal process. In the meantime, this is our new official account. While you are on this page, please support us by sharing and following.
The present consolidation occurs at the cup, and the handle pattern is at the neckline. Once it breaks above $0.00001375, this may prompt a rally to $0.00001658, which is the 0.5 retracement mark of Fibonacci.
In case the price falls below $0.00001300, FLOKI can test the more underlying support zone of $0.00001200 once again. The pattern is still valid and bullish up to that point.
Source: Tradingview
Momentum and Market Structure Support Upside
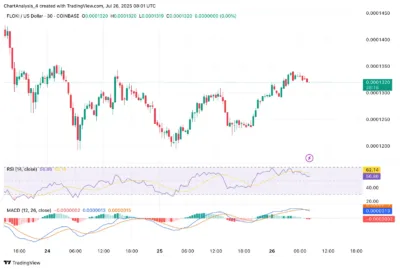
Short-term measures give lower momentum, which amounts to nothing wrong with the bullish pattern. The 30-minute RSI has fallen to 56.8 after cooling into a stable degree of strength, previously 62.1.
The MACD is flat and can take the shape of a bear cross-over. Nevertheless, in the daily chart, there is more positive momentum than negative momentum.
Source: Tradingview
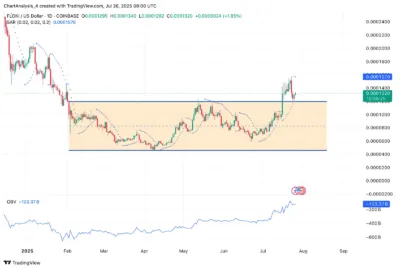
Indicating a sustained bullish trend, the Parabolic SAR dots continue to trail below the price, and the trend is expected to hold as long as FLOKI remains above $0.00001250.
The daily Money Flow Index stands at 86.7, which indicates previous intense inflows and possible short-term consolidations. Provided that inflows resume, this cooling period can be followed by another bullish breakout.
Source: Tradingview
EMA Cluster Confirms Trend Reversal
The exponential moving averages (EMAs) of FLOKI on its daily chart maintain the growth trend while the 20-day moving average is also starting to trend upward around $0.00001260.
This EMA zone coincides with new breakout support, so it is a place to monitor should one experience a pullback. If bulls buy this area, it will serve as a launching pad for an additional leg higher.
The EMAs at a higher level also maintain a bullish condition, indicating a shift towards the move out of consolidation. The arrangement implies that FLOKI is on the verge of a broader trend extension towards the end of 2025.
On-Chain Capital Flows Signal Cautious Sentiment
Although the chart is healthy, the investors’ tone is relatively modest. Signals and the latest spot on Coinglass indicate an average daily outflow of—$300600 on July 26.
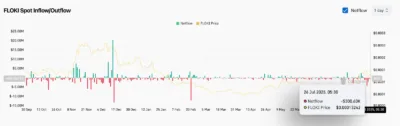
Such a wear of spot inflows represents the effect of diminished purchasing pressure following a recent rally. The On-Balance Volume (OBV) velocity, however, is headed upwards on the daily scale.
According to this, the general accumulation is continuing even though there is some short-term weakness. An increase in flows and volume might be the next impetus for propelling the upward cross of $0.00001375.
FLOKI Price Forecast 2025–2030
| Year | Low ($) | Mean ($) | High ($) |
| 2025 | 0.00001200 | 0.00001500 | 0.00001658 |
| 2026 | 0.00001450 | 0.00001900 | 0.00002500 |
| 2027 | 0.00002000 | 0.00003000 | 0.00004000 |
| 2028 | 0.00002700 | 0.00003500 | 0.00005000 |
| 2029 | 0.00003000 | 0.00004500 | 0.00006000 |
| 2030 | 0.00003500 | 0.00005000 | 0.00007200 |
Year-by-Year Outlook
2025
FLOKI is consolidating just below the neckline of a bullish pattern. If it breaks above $0.00001375, a rally toward $0.00001658 is possible, provided $0.00001200 support holds.
2026
With market recovery and increased project visibility, FLOKI could average around $0.00001900, while a strong rally could lift it toward $0.00002500.
2027–2028
Assuming meme tokens remain relevant and adoption grows, the price could trend toward $0.00004000–$0.00005000. This would require ecosystem development and sustained investor interest.
2029–2030
If FLOKI integrates into DeFi or gaming and sees real-world utility, prices could reach as high as $0.00007200. This depends on broader market cycles and token use cases.
Conclusion
FLOKI is approaching a key decision point near $0.00001375. Technical indicators support a continuation of the uptrend, but stronger inflows are needed for validation.
If price breaks above the neckline, it could test $0.00001550 and move toward $0.00001658. To maintain this structure, bulls must defend $0.00001300 and especially $0.00001200. So far, FLOKI is showing early signs of a renewed bullish phase heading into the second half of 2025.
FAQs
1. Is Floki currently bullish?
Yes. FLOKI has formed a bullish cup and handle structure and remains above key support.
2. What is the next central resistance zone?
$0.00001375 is the immediate neckline resistance breaking it could lead to $0.00001550 and $0.00001658.
3. Where is the strongest support?
$0.00001300 is near-term support, while stronger support lies at $0.00001200.
4. Can FLOKI reach $0.000016 this year?
Yes. If momentum returns, FLOKI could test $0.00001658 before the end of 2025.
5. What’s driving FLOKI’s rally?
A confirmed breakout pattern, positive accumulation, and macro bullish alignment are key drivers.
Also Read: Why 1,000 XRP Could Be Worth $9,000 by 2026, According to Expert Analyst
