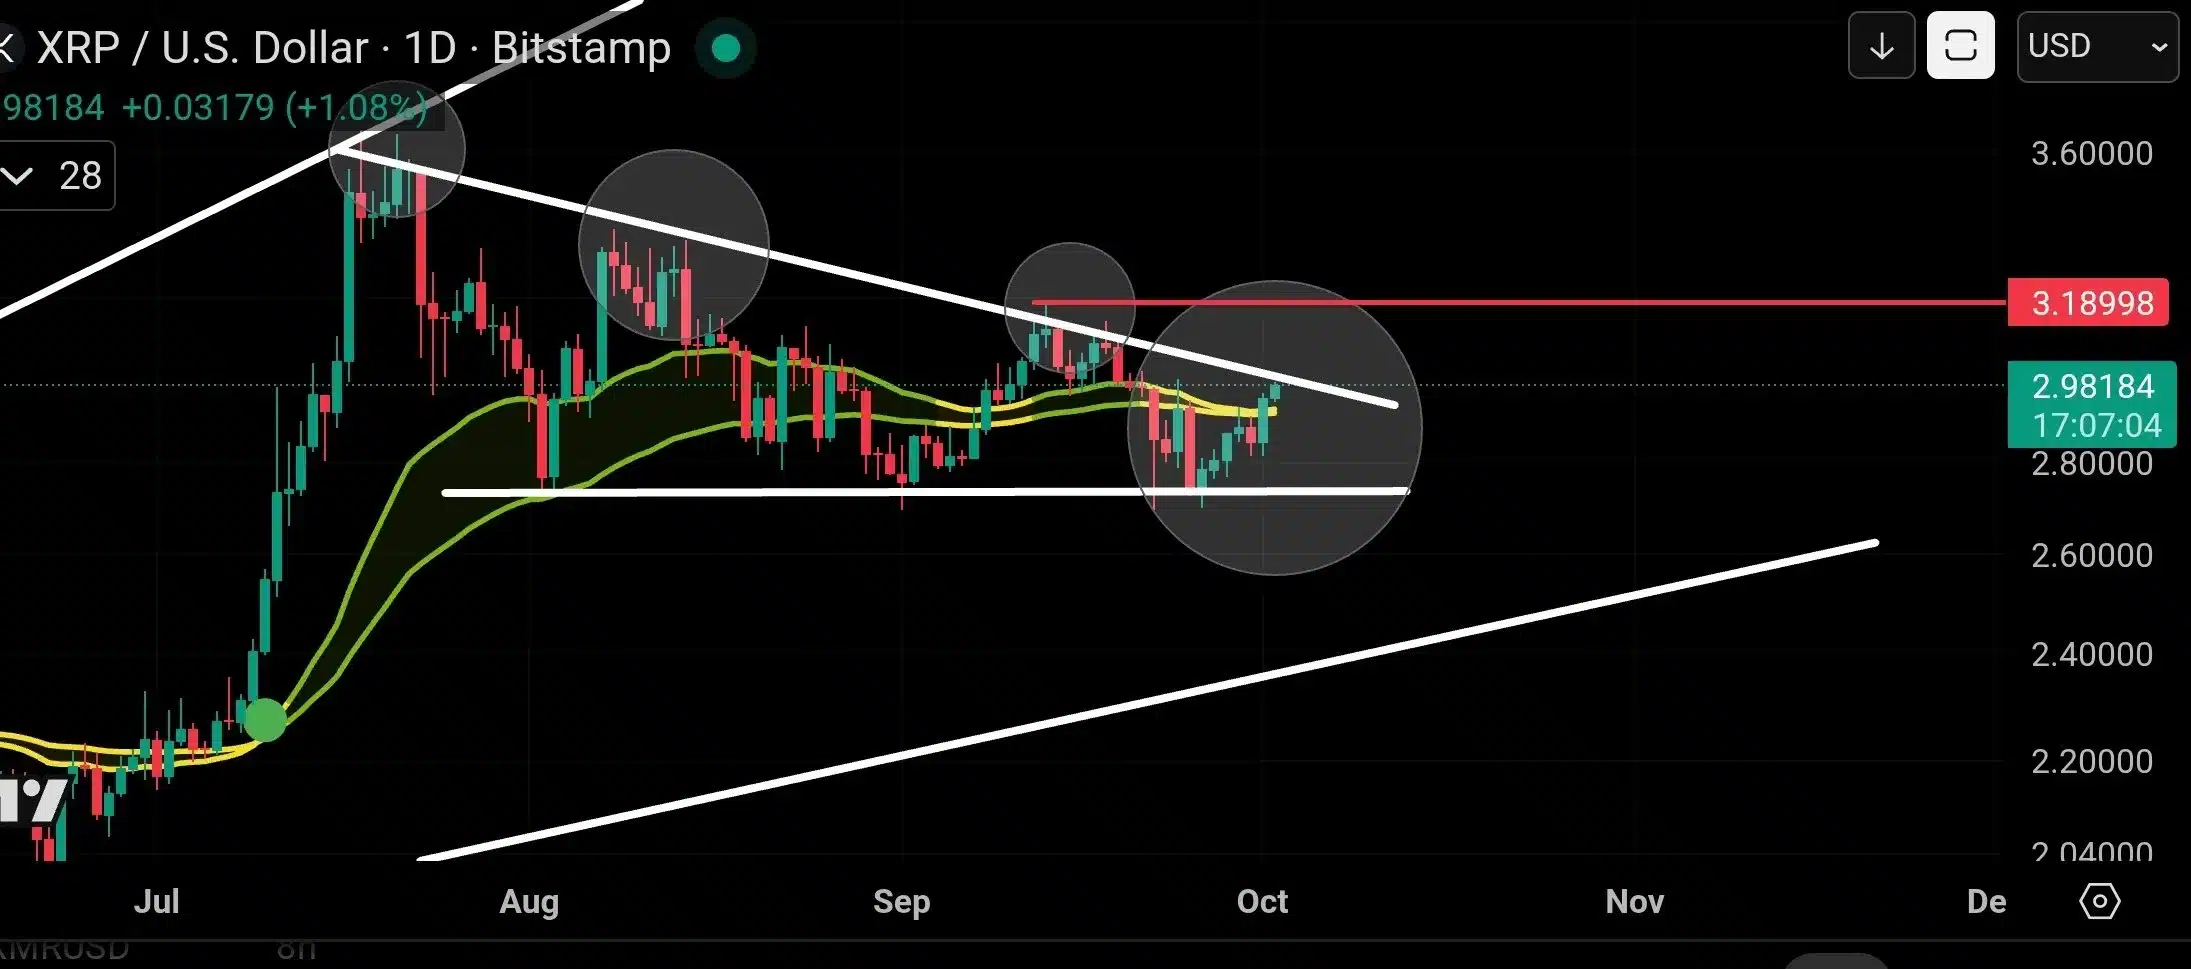
- XRP is nearing the apex of a descending triangle, with price compression signaling an imminent major move.
- A breakout above $3.18 resistance could trigger an impulsive rally toward $4.13 or higher.
- A rejection may push XRP down to $2.65–$2.70 support, potentially forming a larger bullish leading diagonal for future upside.
Popular crypto analyst Coinskid has highlighted what he calls a critical moment for XRP, noting that the token is approaching the apex of a descending triangle formation.
According to his analysis, compression at this level could soon lead to a major breakout or breakdown. “XRP is trying to make a move here,” Coinskid tweeted. “Compression leads to expansion right toward the apex of a descending triangle.”
The Bullish Scenario: $4.13 Target
Coinskid emphasized that if XRP can break above the upper resistance line (around $3.18) marked in red on the chart, the asset could begin an impulsive rally. “If we can see XRP take out the upper red line, we could begin to target an impulsive move up to at least $4.13,” he said.
Also Read: XRP Heatmap Shows a Massive Cluster Around $2.25 – What Does This Mean?
#xrp is trying to make a move here. Compression leads to expansion right toward the apex of a descending triangle.
If we can see #xrp take out the red upper red line we could behin to target an impulsive move up to at least $4.13, another rejection, and I think it rolls to the… pic.twitter.com/14QclTcf9C
— CoinsKid (@Coins_Kid) October 2, 2025
This move would represent a significant upside from the current price near $2.98, marking a potential continuation of XRP’s mid-term bullish structure. On the flip side, Coinskid warned of a possible rejection at resistance, which could push XRP back down toward the ascending white trendline support seen on the chart.
“Another rejection, and I think it rolls to the ascending white line, which would lead to an expanding leading diagonal setup, to target way higher than $4.13,” he explained. This suggests that while a near-term dip could occur, it may still set up a larger bullish structure in the long run.
Chart Analysis: Compression at Key Levels
The chart accompanying Coinskid’s tweet shows XRP trading around $2.98, just under the descending resistance trendline. The red resistance line at $3.18 marks the breakout level to watch, while the horizontal white support line around $2.65–$2.70 provides a strong floor.

Source: CoinsKid/X
If XRP falls back to test the rising white support line, the structure would form a leading diagonal, often associated with the start of larger impulsive moves in Elliott Wave Theory.
“Huge Test Loading”
Summing up his analysis, Coinskid wrote: “huge test loading here for XRP.”
With XRP compressing between resistance and support, the next move could determine whether the token pushes toward $4.13 and beyond or resets with a deeper pullback before another bullish leg.
Also Read: XRP, XDC, HBAR, and LINK: Pundit Claims SWIFT’s Future Runs on These Select Cryptos – Here’s Why
