- Solana trades near $189 as buyers defend crucial support levels.
- ETF optimism lifts sentiment while traders eye resistance around $207.
- Negative netflows persist, signaling cautious market participation.
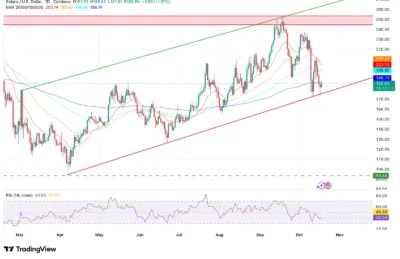
Solana (SOL) continues to consolidate above $186 after rebounding from $181, maintaining its long-term ascending channel. The 200-day EMA around $186 remains a critical marker for sustaining bullish structure amid muted momentum.
According to analysts, the SEC’s approval of 21Shares’ Solana Spot ETF registration has increased confidence, although price remains trapped between $189 and $203 as traders await confirmation of stronger demand.
Also Read: Ethereum (ETH) Price Prediction 2025–2030: Will ETH Reclaim $4,000 Soon?
ETF Optimism Drives Renewed Confidence
The SEC’s recent approval of 21Shares’ Solana Spot ETF registration places SOL alongside Bitcoin and Ethereum in achieving regulatory recognition. The decision has strengthened institutional sentiment, with Polymarket data indicating a 99% probability that full ETF trading will launch before year-end.
Despite temporary delays caused by the U.S. government shutdown, analysts expect reviews to resume soon, allowing issuers such as Bitwise and Grayscale to follow 21Shares. In September, digital asset treasuries added over $2 billion worth of SOL, a 230% monthly increase reflecting growing institutional interest.
Technical Structure Signals Potential Breakout
Solana continues to trade within its ascending channel from March, with support aligning near $180. The 50-day EMA remains a barrier for now, but a close above $203 could signal renewed momentum toward $246 and $270.
The RSI hovers around 40, showing cooling momentum without indicating a downtrend. A rebound from this zone has historically preceded sharp multi-week rallies. A sustained move above $207 would likely confirm a shift toward renewed bullish strength.

Source: Tradingview
Chart Data Shows Negative Netflows and Cautious Liquidity
Latest Coinglass data and the attached chart show that on October 19 2025, Solana recorded a negative netflow of –$3.63 million, with price holding around $189.1. The figure indicates that funds are still leaving exchanges, reflecting continued caution among investors.
Although the netflow remains negative, its magnitude has narrowed compared to earlier months, suggesting that selling pressure is gradually easing. Analysts note that sustained positive inflows above $50 million would be needed to confirm a shift toward renewed accumulation.

Source: Coinglass
Technical Outlook for Solana Price
Immediate resistance lies between $203 and $207, where the 20-day and 50-day EMAs converge. A break above this region could trigger a rally toward $246, then $253 and $270.
Support levels remain firm at $181 and $170, marking key trendline defenses. A failure to hold these zones could send SOL toward $160, though sentiment currently leans bullish as the market stabilizes.
Price Prediction for 2025–2030
| Year | Minimum ($) | Average ($) | Maximum ($) |
| 2025 | 170 | 210 | 270 |
| 2026 | 190 | 240 | 300 |
| 2027 | 220 | 280 | 340 |
| 2028 | 250 | 310 | 380 |
| 2029 | 280 | 350 | 420 |
| 2030 | 320 | 390 | 470 |
Year-by-Year Outlook
2025
Solana is expected to range between $181 and $270 as ETF-related demand and defensive support encourage gradual growth.
2026
If ETF trading launches and institutional inflows return, SOL could approach $300 with renewed buying momentum.
2027
Ecosystem expansion and broader developer activity may support a move toward $340 as DeFi and liquidity improve.
2028
Growing network adoption and capital rotation into on-chain projects could lift Solana above $380.
2029–2030
As institutional integration matures, SOL could trade between $390 and $470, reflecting a stabilized long-term ecosystem.
Conclusion
Solana remains positioned for a potential trend reversal as ETF approval boosts sentiment and technical support stays intact. Although netflows remain negative at –$3.63 million, the declining magnitude of outflows shows that selling pressure is fading.
A decisive break above $207 could open the path toward $250 and beyond. So long as SOL trades above its 200-day EMA near $186, the bias remains constructive with room for a sustained recovery.
FAQs
1. Why is Solana’s netflow negative?
Recent data shows a –$3.63 million netflow, indicating more capital left exchanges than entered them as traders remain cautious.
2. What are the current support and resistance zones?
Resistance sits between $203 and $207, while key supports lie at $181 and $170.
3. What does the ETF approval mean for Solana?
The SEC’s decision to approve 21Shares’ ETF registration has increased institutional interest and confidence in Solana’s long-term potential.
4. What will trigger a bullish reversal?
A sustained daily close above $207 combined with positive net inflows would confirm a shift toward renewed buying momentum.
5. What are the risks if selling continues?
Failure to defend the $181 support could push SOL toward $160, retesting its lower channel boundary.
6. Is Solana still in an uptrend?
Despite temporary outflows, SOL remains above its 200-day EMA and within its ascending channel, preserving the long-term uptrend.
Also Read: Cardano (ADA) Price Prediction 2025–2030: Will ADA Break Past $0.90 Soon?
