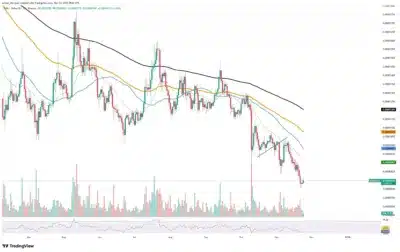
The token slipped into levels usually associated with capitulation phases, which prompted buyers to step in as selling pressure eased. This reaction signaled early exhaustion among sellers and opened room for a short recovery attempt.
Moreover, SHIB still trades below its 50, 100, and 200-day moving averages, which confirms that the broader trend remains bearish. However, trading volume held steady during the downturn and suggested the decline came from controlled unwinding instead of panic-driven exits.
Additionally, analysts noted that the latest rebound comes from technical triggers rather than a sentiment shift. Traders reacted to the RSI reset and the slowdown in downside momentum while waiting for stronger signs of a trend reversal.
Also Read: Grayscale and Franklin Templeton’s XRP ETF Day 1 Projection, How Much Will They Pull?
Recovery zone becomes the main focus as SHIB seeks firmer footing
SHIB may attempt a move toward the $0.0000095 to $0.000010 region if the bounce extends. That area aligns with the 20-day and 50-day moving averages, making it a key resistance zone. A rejection there would indicate that the rebound served only as a temporary pause.
Besides that, price stability above $0.0000080 would suggest that selling pressure has eased. Reduced volatility in that zone may signal early accumulation, which often supports medium-term recovery attempts, although it usually develops slowly.

Source: Tradingview
Consequently, a breakdown remains possible if the bounce loses strength. A close below the recent low could push the token toward the $0.0000070 liquidity pocket, signaling renewed selling momentum. This scenario appears less likely for now due to consistent buy volume during the rebound.
SHIB’s technical bounce has renewed interest across the market as traders watch for signs of sustained strength. Key price zones will determine whether the recovery can continue or if the token slips back into its broader downward trajectory.
Also Read: Big Update on Grayscale and Franklin Templeton XRP ETFs

