


What to Know
- OKB broke above its $82–$87 consolidation range, while rising volume and open interest strengthened confirmation behind the bullish technical breakout.
- Hourly RSI reached 70.81, showing strong buying momentum but signaling that OKB could experience consolidation before extending its broader advance.
- Holding the $93–$95 reclaim zone could strengthen the bullish structure and support advances toward the $110 and $124 resistance targets.
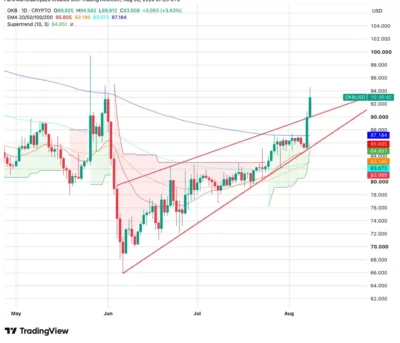
OKB has strengthened its technical outlook following a decisive breakout from the $82–$87 consolidation range, with price reaching $94.58 before holding around $93.01. The move pushed OKB above several important exponential moving averages, strengthening the bullish structure that developed from the June lows.
TradingView data shows the 20-day EMA around $85.81, while the 50-day and 100-day EMAs stand near $83.15 and $83.07, respectively. The 200-day EMA at $87.18 has also moved below the current price, giving buyers several technical support levels if the breakout experiences a pullback.
However, the hourly Relative Strength Index at 70.81 has entered overbought territory, suggesting the rally may require some consolidation before another sustained advance develops.
Also Read: Cronos (CRO) Price Prediction 2026–2030: Can CRO Hit $0.100?
Bulls Take Control Above $87 Resistance
OKB’s breakout followed several weeks of compression between a rising trendline and resistance around $87, creating an ascending triangle structure. Price eventually cleared the upper boundary and moved above the major EMA levels, strengthening the bullish technical setup.
We're back on X.
— 36Crypto (@36Crypto1) August 21, 2026
Our previous account (36crypto2) is currently unavailable while we continue working through the appeal process. In the meantime, this is our new official account. While you are on this page, please support us by sharing and following.
The former $87 resistance zone has become an important support area, with the 200-day EMA positioned around $87.18. Below that level, the 20-day EMA at $85.81 and Supertrend near $84.85 provide additional support.
On the upside, $94.58 represents the immediate resistance following the breakout. Analyst Nehal identified the $93–$95 region as an important reclaim zone, with $110 and $124 representing potential targets if buyers maintain control above this area.
Technical Outlook
Momentum indicators support the broader bullish structure, although shorter-term conditions appear stretched. The hourly RSI reading of 70.81 reflects strong buying pressure while also placing OKB inside overbought territory.
Meanwhile, MACD stands around 1.568 and remains positive, reinforcing bullish momentum. A controlled pullback that keeps OKB above the $87.18 support level could allow buyers to reset momentum without damaging the breakout structure.
Derivatives activity also strengthened alongside the rally. Trading volume climbed 110.52% to $39.48 million, while open interest increased 19.24% to $24.93 million, indicating additional positions entered the market during the breakout.
Source: Tradingview
OKB Price Prediction (2026–2030)
| Year | Minimum | Average | Maximum |
|---|---|---|---|
| 2026 | $82 | $100 | $124 |
| 2027 | $95 | $125 | $155 |
| 2028 | $110 | $150 | $190 |
| 2029 | $130 | $180 | $230 |
| 2030 | $150 | $220 | $300 |
Price Forecast by Year
2026
OKB could trade between $82 and $124 if buyers defend the former consolidation resistance and maintain the breakout structure. Holding $93–$95 would strengthen the possibility of reaching the $110 and $124 targets.
2027
Sustained buying activity and improving broader cryptocurrency conditions could support an advance toward $155, provided OKB establishes previous resistance zones as longer-term support.
2028
Greater market participation and continued demand could allow OKB to approach $190. Maintaining the broader bullish structure would remain important for supporting this longer-term projection.
2029
If accumulation remains strong and cryptocurrency market conditions improve, OKB could extend its longer-term advance toward $230 while establishing higher support levels.
2030
Under a bullish scenario supported by stronger adoption, sustained demand and favorable digital asset market conditions, OKB could potentially reach $300 by 2030.
Spot and Derivatives Activity Strengthens
Spot netflow registered approximately $120,230 positive on August 8 following exchange inflows exceeding $2 million during the previous session. The shift accompanied OKB’s price breakout, indicating stronger market activity around the move.
Derivatives markets also recorded significant growth. Alongside the 110.52% volume increase, open interest climbed 19.24%, while the overall long/short ratio remained nearly balanced at 0.9944.
Liquidations reached approximately $50,260 over 24 hours, with shorts accounting for $49,740 compared with only $525.68 in long liquidations. The imbalance shows that bearish positions absorbed most of the losses as OKB moved beyond resistance.
Conclusion
OKB’s technical structure has improved considerably following the breakout above the $82–$87 consolidation range, supported by rising trading volume, increasing open interest and a bullish EMA structure. However, the hourly RSI above 70 suggests buyers may encounter short-term exhaustion around current levels.
Holding the $93–$95 region would strengthen the bullish outlook and improve the probability of an advance toward $110 and $124. Conversely, losing $87.18 could weaken the breakout and expose the $85.81 and $84.85 support levels.
FAQs
1. Is OKB currently bullish?
Yes. OKB has broken above the $82–$87 consolidation range and moved above several major exponential moving averages, strengthening its bullish technical structure.
2. What does the OKB RSI indicate?
The hourly RSI around 70.81 indicates strong bullish momentum, although the overbought reading increases the possibility of short-term consolidation or a pullback.
3. What are OKB’s major resistance levels?
Immediate resistance stands around $94.58, while $110 and $124 represent the next important upside targets if the breakout remains intact.
4. Can OKB reach $124?
OKB could challenge $124 if buyers maintain the breakout above $93–$95, trading activity remains strong and broader cryptocurrency conditions remain supportive.
5. What risks could limit OKB’s upside?
Failure to hold $87.18, declining derivatives activity, weakening altcoin demand and broader cryptocurrency market weakness could undermine the breakout and pressure OKB lower.
Also Read: Mantle (MNT) Price Prediction 2026–2030: Can MNT Hit $1.00?
