


What to Know
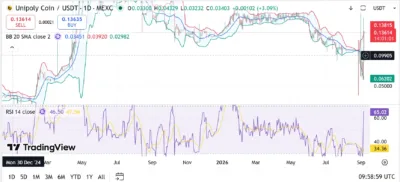
- UNP rebounded toward $0.13614 after a steep selloff, reclaiming the Bollinger midpoint and restoring bullish momentum on its daily chart.
- The RSI surged to 65.02, showing renewed buyer strength while remaining comfortably below the conventional 70 overbought threshold for now.
- Resistance near $0.13815 could determine whether UNP extends its recovery, while $0.09905 now forms the most important immediate support zone.
Unipoly Coin (UNP) has staged a powerful recovery on the daily chart, rebounding from a steep decline that briefly pushed its price below $0.050. The token is trading near $0.13614, placing it just beneath the upper Bollinger Band at approximately $0.13815.
The rebound has helped UNP reclaim the $0.09905 middle Bollinger Band, which previously acted as an important resistance area. Furthermore, the Relative Strength Index (RSI) has climbed to 65.02, reflecting strong buying pressure without placing the token inside conventional overbought territory.
However, UNP is approaching a decisive technical barrier. A sustained breakout above $0.13815 could support another bullish leg, while rejection from this area may encourage traders to secure profits following the rapid recovery.
Also Read: XRP Price Prediction 2026–2030: Can XRP Recover and Reach $5?
Buyers Regain Control of UNP
We're back on X.
— 36Crypto (@36Crypto1) August 21, 2026
Our previous account (36crypto2) is currently unavailable while we continue working through the appeal process. In the meantime, this is our new official account. While you are on this page, please support us by sharing and following.
UNP experienced considerable volatility after falling from its established trading range and briefly approaching the $0.030 region. Buyers quickly entered around the lower levels, producing a strong rebound that returned the token above $0.09905.
This recovery transformed the Bollinger midpoint into immediate support. Holding above that level would indicate that buyers have regained control of the broader structure, although the large daily price swings underline the speculative nature of the move.
The upper Bollinger Band near $0.13815 represents the first major resistance. A daily close above this boundary could confirm a volatility-driven breakout and allow UNP to challenge the $0.150 and $0.170 regions.
Meanwhile, the lower Bollinger Band sits around $0.06202. Although this level remains far beneath the current price, it could become relevant if selling pressure returns and UNP loses the Bollinger midpoint.
RSI Supports the Bullish Recovery
The daily RSI reading of 65.02 strengthens the bullish argument because it shows that momentum has shifted decisively toward buyers. The indicator has rebounded from near-oversold territory and moved above its RSI-based moving average, displayed near 34.36.
Despite this improvement, traders should monitor the 70 threshold. An RSI move above 70 would confirm stronger momentum but could also signal increasingly overheated conditions, particularly following such a rapid price recovery.
If the RSI stabilizes between 55 and 70 while UNP holds above $0.09905, the token could consolidate without damaging its bullish structure. Conversely, an RSI reversal below 50 would suggest that buying pressure is weakening.
Technical Outlook
UNP’s short-term outlook depends heavily on the $0.13815 resistance level. A confirmed daily breakout above this area could establish $0.150 as the next psychological target, followed by possible advances toward $0.170 and $0.200.
Failure to clear the upper Bollinger Band would increase the probability of consolidation. In that scenario, the $0.120 region could provide initial support before attention returns to the crucial $0.09905 midpoint.
A daily close below $0.09905 would weaken the recovery and expose UNP to a deeper retracement toward $0.080. More aggressive selling could eventually bring the lower Bollinger Band near $0.06202 back into consideration.
Source: Tradingview
UNP Price Prediction (2026–2030)
| Year | Minimum | Average | Maximum |
|---|---|---|---|
| 2026 | $0.080 | $0.145 | $0.200 |
| 2027 | $0.110 | $0.180 | $0.240 |
| 2028 | $0.140 | $0.225 | $0.300 |
| 2029 | $0.175 | $0.275 | $0.360 |
| 2030 | $0.210 | $0.330 | $0.430 |
Price Forecast by Year
2026
If UNP converts $0.13815 into support and preserves its improving momentum, the token could trade between $0.145 and $0.200. Losing $0.09905 would instead increase downside risk toward $0.080.
2027
Stronger liquidity and broader market participation could help UNP establish a higher trading range, with $0.240 representing the optimistic target under favorable cryptocurrency market conditions.
2028
A sustained expansion of the Unipoly ecosystem, combined with bullish market sentiment, could support an advance toward $0.300. However, reaching this target would require continued demand and significantly improved liquidity.
2029
UNP could approach $0.360 if it maintains a long-term pattern of higher highs and higher lows. Weak adoption or declining trading activity could restrict the token nearer the projected $0.175 minimum.
2030
Under the strongest long-term scenario, UNP could trade around an average of $0.330 and potentially reach $0.430. This forecast remains speculative because the token’s chart displays substantial volatility and sudden price movements.
Conclusion
UNP has produced an impressive recovery, reclaiming the $0.09905 Bollinger midpoint and returning to the upper band near $0.13815. Its RSI reading of 65.02 confirms strengthening momentum while leaving limited room before overbought conditions emerge.
A daily close above $0.13815 could strengthen the bullish structure and open a path toward $0.150, $0.170, and eventually $0.200. Nevertheless, rejection at resistance could trigger consolidation toward $0.120 or $0.09905.
Although the long-term forecast presents a possible move above $0.30, that outcome depends on sustained demand, ecosystem development, adequate liquidity, and supportive market conditions.
FAQs
1. Is UNP currently bullish?
Yes. UNP is trading above the middle Bollinger Band, while an RSI reading of 65.02 indicates that buyers currently control momentum.
2. What is UNP’s main resistance level?
The immediate resistance sits near the upper Bollinger Band at $0.13815. A confirmed breakout could expose $0.150 and $0.170.
3. What is the most important UNP support?
The Bollinger midpoint near $0.09905 represents the principal support. Below it, traders may monitor $0.080 and the $0.06202 lower band.
4. Can UNP reach $0.30?
UNP could approach $0.30 by 2028 under favorable conditions, although this projection remains speculative and requires sustained long-term growth.
5. What could invalidate the bullish outlook?
A close below $0.09905, weakening RSI, poor liquidity, heavy profit-taking, or broader cryptocurrency market losses could undermine the recovery.
Also Read: Zcash (ZEC) Price Prediction 2026–2030: Can ZEC Hit $2,100 Soon?
