

What to Know
- Aethir trades at $0.007821, gaining 7.09% on the daily candle as buyers push its price above the upper Bollinger Band.
- ATH’s RSI stands at 79.60, indicating strong buying momentum, although its overbought position increases the possibility of a price pullback.
- Holding above $0.007631 could support another attempt at $0.008489, while longer-term forecasts depend on sustained demand and broader cryptocurrency market conditions.
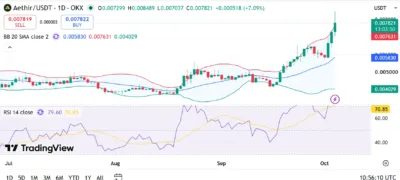
Aethir (ATH) trades above its upper Bollinger Band, with the daily chart showing a price of $0.007821 and a 7.09% gain. According to the TradingView daily chart for Aethir/USDT on OKX, the session opened at $0.007299, reached $0.008489, and recorded a low of $0.007037.
The advance places ATH above the upper band at $0.007631, while the 14-day Relative Strength Index stands at 79.60. Buyers retain strong momentum, although the retreat from the session high and elevated RSI make support levels important to the next move.
Also Read: Gram (GRAM) Price Prediction 2026–2030: Can GRAM Hit $2 Soon?
ATH Breaks Above Its Recent Trading Range
ATH has advanced beyond the price range that contained much of its July-to-September trading, with several strong daily candles lifting the token toward $0.0085. The latest candle extends that recovery, although its upper wick shows that some of the session’s gains have been surrendered.
The session high of $0.008489 marks the nearest visible resistance. A sustained break above this level could bring the round-number levels of $0.009 and $0.01 into consideration, with $0.01 sitting approximately 27.9% above the displayed price.
We're back on X.
— 36Crypto (@36Crypto1) August 21, 2026
Our previous account (36crypto2) is currently unavailable while we continue working through the appeal process. In the meantime, this is our new official account. While you are on this page, please support us by sharing and following.
However, a failure to reclaim $0.008489 could leave ATH consolidating around the upper Bollinger Band before another directional move.
Bollinger Bands Identify Key Support Levels
ATH’s Bollinger Bands show an upper boundary of $0.007631, a middle band of $0.005830, and a lower boundary of $0.004029. Their widening separation accompanies the recent increase in price volatility.
The upper band provides an immediate reference for assessing whether the breakout holds. Sustained trading above $0.007631 would preserve ATH’s position outside the band, while a return below it would show that price has moved back inside the indicator’s range.
Below that level, the session low of $0.007037 offers another nearby reference. A deeper retracement would bring the middle band at $0.005830 into consideration, followed by the lower band at $0.004029.
RSI Shows Strong but Elevated Momentum
ATH’s RSI reading of 79.60 exceeds the conventional overbought threshold of 70 and its displayed moving average of 70.85. This position indicates that recent buying momentum remains stronger than its smoothed baseline.
An overbought reading does not establish that a reversal will occur, since RSI can remain elevated during sustained advances. Nevertheless, the indicator leaves ATH vulnerable to a cooling period if buyers fail to extend the rally.
A move above $0.008489 accompanied by resilient RSI would support the bullish technical picture. Conversely, falling RSI alongside a loss of $0.007631 would indicate weakening breakout momentum.
Source: Tradingview
Aethir (ATH) Price Prediction 2026–2030
| Year | Minimum | Average | Maximum |
|---|---|---|---|
| 2026 | $0.0040 | $0.0075 | $0.0100 |
| 2027 | $0.0035 | $0.0090 | $0.0150 |
| 2028 | $0.0040 | $0.0120 | $0.0200 |
| 2029 | $0.0050 | $0.0160 | $0.0300 |
| 2030 | $0.0060 | $0.0200 | $0.0400 |
Price Forecast by Year
2026
ATH could approach the illustrative $0.01 maximum if buyers maintain support around $0.007631 and overcome $0.008489. The $0.0075 central scenario represents consolidation near the current breakout area, while a substantial reversal toward the lower Bollinger Band would align with the $0.0040 bearish scenario.
2027
The $0.0150 bullish scenario would require ATH to establish higher trading ranges beyond $0.01. Meanwhile, the $0.0090 central scenario assumes a more moderate recovery, with repeated breakout failures and weaker demand potentially pushing price toward the illustrative $0.0035 minimum.
2028
A sustained upward trend could support the $0.0200 scenario, while $0.0120 represents a less aggressive outcome. Reaching either level would require demand to persist beyond the current rally, whereas prolonged selling pressure could leave ATH nearer the $0.0040 bearish scenario.
2029
The illustrative $0.0300 maximum assumes further expansion in ATH’s trading range under favorable market conditions. A more restrained advance could place price around $0.0160, while a renewed downturn could bring the $0.0050 minimum into consideration.
2030
The $0.0400 bullish scenario represents approximately five times the displayed price, requiring substantial appreciation over several years. Longer-term demand could be influenced by ATH’s role in payments, staking, and governance within the Aethir network. The central and bearish scenarios stand at $0.0200 and $0.0060, respectively.
Conclusion
Aethir’s daily chart shows strong upward momentum, with price above the upper Bollinger Band and RSI at 79.60. The immediate technical levels are $0.007631 for potential breakout support and $0.008489 for resistance.
Clearing the session high could support a move toward $0.009 and $0.01. However, the elevated RSI and retreat from the high leave room for consolidation or a pullback before further gains.
FAQs
1. Is ATH bullish on the daily chart?
ATH shows bullish momentum through its position above the upper Bollinger Band and an RSI of 79.60, although both readings accompany increased pullback risk.
2. What is ATH’s immediate resistance?
The session high of $0.008489 is the nearest visible resistance, followed by the round-number levels of $0.009 and $0.01.
3. Which support levels matter for ATH?
The upper Bollinger Band at $0.007631 is the immediate reference, followed by the session low of $0.007037 and middle band at $0.005830.
4. Is ATH’s RSI overbought?
Yes. The displayed RSI of 79.60 exceeds the conventional overbought threshold of 70.
5. Can ATH reach $0.01?
A move to $0.01 would require approximately 27.9% appreciation from $0.007821. Holding the breakout area and clearing $0.008489 would strengthen that scenario, although the chart provides no reliable timetable.
Also Read: Utya (UTYA) Price Prediction 2026–2030: Can UTYA Hit $0.10 Soon?
