- Whales accumulate over 218,000 BTC during market consolidation phase.
- Bitcoin hovers near key resistance, signaling potential breakout ahead.
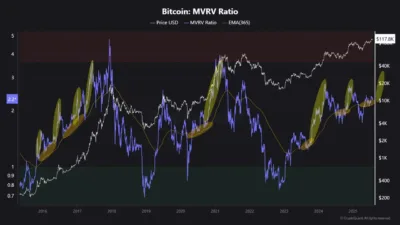
- MVRV ratio aligns with yearly average, indicating bullish market setup.
Large Bitcoin holders are steadily increasing their positions as the market shows signs of preparing for a significant upward move. Despite price action appearing stagnant, recent on-chain activity points to a potential shift in momentum.
According to Santiment, wallets with a total of 10 to 10,000 BTC have received more than 218,000 BTC since the end of March. This illustrates that these players now own over 68 percent of the total circulating supply of Bitcoin and show more interest from big players.
This is the accumulation normally witnessed by large holders when there is technical consolidation. Technical historical data depict that such behavior is associated with major rallies, where they warn before key rallies.
Also Read: Ripple Begins Search for Vice President to Lead Institutional DeFi Partnerships
On-Chain Indicators and Technical Setup Hint at Bullish Expansion
Data from CryptoQuant shows the Market Value to Realized Value ratio has reached 2.2. This figure is now closely aligned with the 365-day moving average, a convergence that has historically acted as a precursor to price expansion.
The MVRV ratio, when below 1, has been an indicator of bottoms, and when above 3.7, an indicator of a top. As the current figure indicates a neutral position, it entails a market that is in balance; hence, with the chances of a rise imminent, control is subsiding.

Source: CryptoQuant
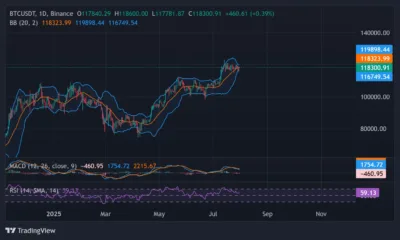
Also, Bitcoin is stuck in the middle of the Bollinger Bands at around $118,300. This is considered one of the significant short-term points of support. An upsurge to the top band at nearly $119,900 might pave the way to new energy.
Momentum indicators remain directionless, with the Relative Strength Index calculated at 59.13, reflecting moderate strength. The MACD crossed a bit bearishly but is still positive, which supports the notion that a period of consolidation is continuing to play out.
The short-term supports are at $116,750. A pullback below said level would at least postpone additional bullish purchases, but with large wallets continuing to accumulate, a sustainable lower resistance is not on the cards.

Source: Tradingview
Break Above Resistance Could Trigger Extended Price Discovery
If Bitcoin manages to close above the $120,000 resistance level, analysts expect a swift expansion into higher price ranges. The existing forecasts indicate that a decisive breakup would send the figure down the path, in the neighborhood of the $125,000 to the $130,000 range in the short term.
Institutional amassing and a strong technical framework would be the factors favouring this envisaged step. Momentum indicators are pointing toward a healthy situation, and the large wallet holders are continuing to exert buying pressure, so the market is set to have a prolonged upswing as and when the resistance is overcome.
Bitcoin is still consolidating slightly below a critical resistance level, and whales are buying more. With both on-chain and technical data aligning, the next directional move could define the tone for the coming months.
Also Read: PublicSquare Taps Crypto Bank CEO Caitlin Long in Bold Bitcoin Move
