Bitcoin has fallen back below the $107,000 mark after failing to break through key resistance levels for the second time in less than 48 hours. The decline comes as bulls lose momentum near $107,500, a zone that continues to cap upside attempts and signals increasing market uncertainty.
The latest dip saw BTC retreat to around $106,970 after briefly retesting $107,500. This price has become a good resistance level, coincident with the upper Bollinger Band and short-term exponential moving averages of the 4-hour chart.
Buyers were turned back again in this zone, and it did not take long before sellers took centre stage.
Current price movement shows Bitcoin trading below the resistance zone between $108,000 and $110,500. It is a merge zone and features key Fibonacci retracement levels. It has served as a ceiling during the recent rally.

Source: Tradingview
Although the pair has yet to break below the 0.618 Fibonacci support at 105,889, the market’s bullish momentum is visibly running out.
On the daily chart, bearish indications are emerging as the Supertrend has reversed to a sell signal at $106,450, while the Parabolic SAR has already produced a dot above the price, signaling downward pressure.
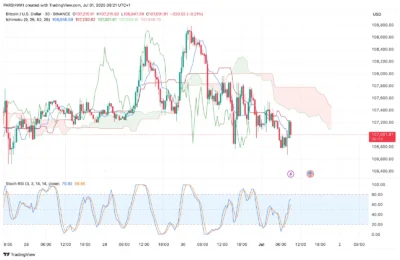
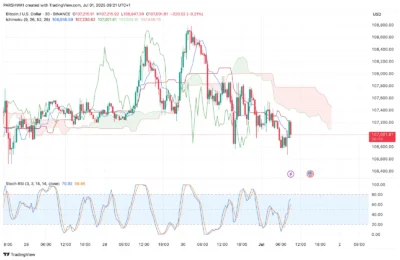
Also, the Ichimoku cloud with 30 minutes indicates that BTC is within the cloud and trades below the Tenkan and Kijun, which is a sign of short-term indecision.

Source: Tradingview
Also Read: XRP Breakout Sparks $2.40 Price Target After Major Ledger Upgrade Hits
Bearish Signals Increase as Liquidity Shifts and Momentum Weakens
Meanwhile, momentum continues to weaken as a bearish crossover on the Stoch RSI has emerged from the overbought zone, further supporting a declining outlook. Over $9.6 million in long positions were liquidated on July 1, adding to the bearish sentiment and allowing bears to regain control.

Source: Tradingview
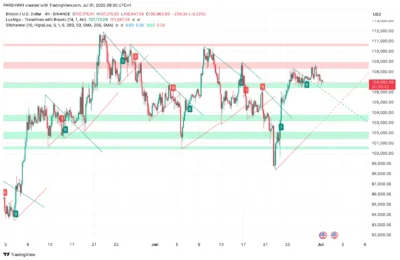
Notwithstanding the decline, Bitcoin’s wider categorization is still functional at present. On the 4-hour chart, the lows are rising, above the bottom on June 24 at $101,900, and the internal trendline is maintained.
Nevertheless, the recurring rejection of levels around $108,000 creates a fear of a stronger pullback if such support is broken around $105,500.
The converging Bollinger Bands on the 4-hour chart are indicating a break in the future. Closure above $108,500 daily would revive the bull trend to $110,500 and $118,000.

Source: Tradingview
However, should BTC lose that price ($105,500), it can potentially drop to lower levels near or below $103,200 and even $101,250 within the short term.
Bitcoin price has been unable to sustain above $107,000, and this is a bad sign since the resistance is growing as bearish signals accumulate.
As buyers fail to overcome the main resistance, they are getting closer to a steeper decline into the following trading day. Traders now look to the $105,500 support to give them an idea of a future direction.
Also Read: Vitalik Buterin Reveals Bold Plan to Make Ethereum Easy for Everyone to Use
