- Bitcoin’s dip hides strength as indicators hint at massive rally ahead.
- Analysts say short-term panic masks the beginning of major uptrend.
- Technical signals confirm Bitcoin’s bull run could just be starting.
Bitcoin’s latest decline has stirred unease among traders, but on-chain data and technical indicators reveal a stronger story beneath the surface. Despite recent volatility, analysts believe the long-term uptrend remains intact, hinting that the market may only be in the early stages of a major bull cycle.
According to CoinDesk analysis, Bitcoin’s 200-week Simple Moving Average (SMA), one of the most trusted long-term indicators, remains well below its 2021 peak. This positioning suggests the broader bull market has not yet reached its climax.
Historically, major tops have occurred when the 200-week SMA rises to meet or challenge the prior cycle’s high. With the current SMA at $54,750 still far from Bitcoin’s 2021 top, the data support the view that a much larger move could be forming.
Short-Term Panic, Long-Term Strength
The recent price dip, which extended across four consecutive sessions, has been driven largely by short-term traders. According to CryptoQuant analyst CryptoOnchain, the sell-off followed the Federal Reserve’s rate cut, turning into a classic “sell-the-news” reaction.
Binance data showed more than 10,000 BTC inflows on October 30, primarily from addresses holding coins for less than a day. This pattern points to fast-moving speculative traders exiting positions, while long-term holders remain steady.
Also Read: Monica Long Reveals Ripple’s Growing Power in Real-Time Global Payments
Such shakeouts are not uncommon during bull markets. They often clear out leveraged positions, allowing stronger hands to reaccumulate at lower levels. Consequently, analysts argue this recent volatility reflects short-term nervousness rather than a change in Bitcoin’s fundamental trajectory.
Indicators Hint at Rebound Potential
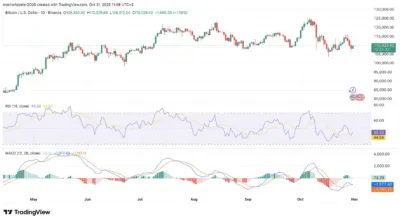
At press time, Bitcoin traded at $109,779, down 0.94 percent over 24 hours, with a market capitalization of $2.19 trillion. The Relative Strength Index stands at 45.32, indicating neutral momentum but a gradual recovery from oversold territory.
Meanwhile, the MACD line at 1,077.40 is approaching the signal line at 1,151.11, and a positive histogram reading of 73.70 suggests fading bearish pressure.

Source: Tradingview
If the RSI pushes above 50 and the MACD confirms a bullish crossover, Bitcoin could retest resistance levels between $115,000 and $118,000. However, losing support at $108,000 may open a path toward $102,000.
Despite the short-term swings, analysts emphasize that the broader bullish structure remains intact. With the 200-week SMA still rising and market behavior mirroring early bull market conditions, the recent dip could simply be the calm before Bitcoin’s next explosive move.
Also Read: Shiba Inu Whales Withdraw 147 Trillion SHIB — Massive Accumulation Sparks Bullish Buzz
