Last updated on May 18th, 2024 at 12:53 pm
The largest cryptocurrency in the world, Bitcoin is on a rally, reaching a new-year high of $52k on February 15. However, the Bitcoin rally might continue to $75k as predicted by a technical pattern revealed by a prominent voice in the crypto community.
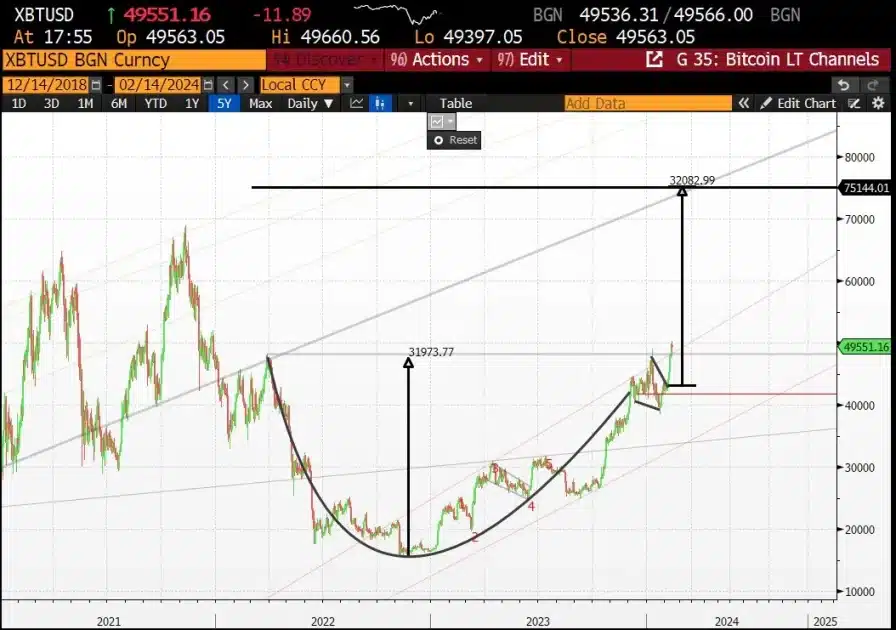
The Chief Investment Officer at Build Asset Management, Matt Dines, has drawn our attention to a likely occurrence in the Bitcoin technical chart. He identified a pattern on the chart known as a ‘cup and handle.’
He gave a detailed illustration showing how this pattern may likely play out and shoot the price of Bitcoin to the $75,000 level. Cup and handle formation is a technical pattern that is keenly watched by experienced market traders and it signals a bullish outcome.
Dines’s Cup and Handle technical analysis
The pattern’s “Cup,” which resembles a bowl or rounded bottom, started to take shape in March 2022, when the price of Bitcoin fell below $48,000 and the crypto market experienced one of the longest bear run in history. At roughly $17,600, the pattern reached its trough, indicating a level of strong support for Bitcoin.

Source X: @BuildCIO
Observing the chart, the pattern’s left side has a rounded bottom that looks like a “cup.” It develops when the price drops at first, stabilizes, and then begins to increase once more.
Since reaching this low point, the price of Bitcoin has steadily increased, resembling the right half of the cup and signaling a positive reversal of the earlier decline.
Dines continues by stressing that the cup indicates a strengthening period where the price decline of BTC takes a pause and then starts to move upward to the test resistance level.
The ‘cup’ part of the pattern is finished by a recovery to the original resistance line. Early in January of this year, the price of Bitcoin finished this phase.
In addition, the recovery is followed by a little retracement that creates a little dip or retreat from the peak, which is symbolic of the next “Handle.” This handle represents the last consolidation before a breakout, and it can be recognized by its mild downward direction.
At the end of January this year, the price of Bitcoin dipped to $38k, signifying the bottom of the pullback. The cup and handle pattern has been confirmed by the price of Bitcoin with its breakout above $48,000.
Bitcoin to $75k?
According to the chart, the distance between the cup’s lowest point and the resistance level is around $31,973, which represents the rise in the price of Bitcoin from its lowest point to the time at which the chart was created.
This height projected from the handle’s structure points to a target close to $75,000 region. However, Dines pointed out that this can only be feasible with the collective behavior of market participants.
“A lot of those longs would set a retrace at ~$75k as they close out their W. If enough participants put this trade on it will set the dominant price action … they win out and it will turn the chart into reality. I know it sounds ridiculous, but in the real world this is how markets discover price,” he said.
According to data from Coinstats, Bitcoin is currently trading at $52,316, representing a 2.31% increase in the last 24 hours and a 17% increase in the last 7 days. Furthermore, the market cap of the asset has once again crossed the $1 trillion mark resting at $1.026 trillion.
Free Tool: Use our simple crypto profit calculator to calculate your potential profits and returns on your cryptocurrency investments.<<<
Read more:
