Last updated on June 2nd, 2025 at 01:08 pm
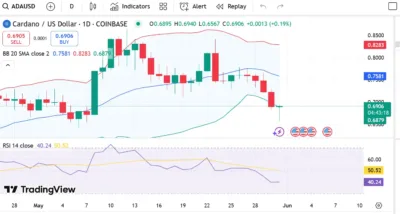
Cardano (ADA), the eighth-largest cryptocurrency by market cap, has shown early signs of a technical rebound after several days of bearish movement. The asset is currently priced at $0.6906, registering a minor intraday gain of +0.19% after dipping to a daily low of $0.6567.
A widely followed proof-of-stake blockchain, Cardano remains a long-term favorite for developers and institutions due to its scalability, low fees, and environmentally friendly consensus mechanism. Despite recent bearish sentiment in the altcoin space, ADA is holding ground near key technical levels and may be preparing for a price recovery heading into the summer of 2025.
Also Read: Cetus Price Prediction 2025–2029: Can CETUS Reclaim $0.165 Soon?
Technical Analysis
Bollinger Bands Overview
On a 20-day Simple Moving Average chart, ADA is near the lower Bollinger Band, showing it has recovered from trading lower. When the RSI falls below the 30 level, it shows the asset might be in oversold territory. The SMA of 50 is currently at $0.7581, with the upper band sitting at $0.8283.
According to the price action, ADA may have stabilized for now, pointing to a short-term trend toward a price reversal. If ADA rises above $0.70 with substantial volume, a move toward the midline at $0.76 could happen.
RSI Behavior
The RSI is currently at 40.24, and its average is 50.52 over 14 days. ADA thus sits in the neutral-to-weak region, with prices far from overbought but getting close to the oversold level of 30. If the RSI increases and moves above its average, it can be verified that the bullish reversal is continuing.
In the past, the ADA price has risen when the RSI crosses 50 after a fall. Traders are closely following any indication of such a change.
Support and Resistance Zones
Support is clearly visible at $0.6879, the lower Bollinger Band, which has acted as a bounce point. Another support point is located at $0.6567, yesterday’s low price.
The good news is that the first significant resistance is the 20-day SMA at $0.7581. If the candle finishes the day above the 50-day MA, it would mean the bulls are once again in charge. After a break above the current level, ADA’s next resistance stands at $0.80; then it rises to the upper Bollinger Band at $0.8283.
Cardano (ADA) Price Prediction Table (2025–2029)
| Year | Minimum Price | Average Price | Maximum Price |
| 2025 | $0.60 | $0.95 | $1.30 |
| 2026 | $0.85 | $1.20 | $1.60 |
| 2027 | $1.00 | $1.40 | $1.85 |
| 2028 | $1.20 | $1.65 | $2.10 |
| 2029 | $1.35 | $1.90 | $2.50 |
Year-by-Year Price Breakdown
2025
For this year, I expect ADA to be around $0.95, though if market conditions improve, it could rise to $1.30. The main factors might be that Hydra is now in use, and a larger number of users are staking their crypto. If prices continue to drop, $0.60 is a crucial level of support for the bears.
2026
By 2026, the demand for secure and environmentally responsible blockchains is likely to help Cardano. The price could range between $0.85 and $1.60, averaging near $1.20. Enterprise partnerships and DeFi ecosystem expansion will be major catalysts.
2027
As more people use Web3, Cardano should gain from its energy-efficient network. By the end of the year, ADA could reach $1.85, with an average yearly price of about $1.40. Improvements in dApp tools and integrations on Layer-2 could encourage institutions to invest in blockchain projects.
2028
With growing use cases in decentralized identity, education, and supply chain, ADA could establish a higher trading range between $1.65 and $2.10. If more regions use cryptocurrencies and they become more widely adopted, an average price of $1.65 could result.
2029
ADA may overcome important resistance points during the final year of its forecast and target of $2.50. If more long-term holding, clearer regulations, and wider adoption are achieved, the price of cryptocurrencies could remain at about $1.90 through most of the year.
Conclusion
According to the technical analysis, Cardano is showing signs of stronger bullish momentum as its RSI steadies and its price moves above the lower Bollinger Band. If the token reaches above $0.69 and moves above the 20-day moving average, a minor uptrend could appear.
The basics of ADA are still strong in the long run. Its energy-saving features, strict development methods, and active community set it up for further advancements. Achieving $1.50 can still happen in 2025 or 2026, but it will depend largely on better macro and on-chain activity.
FAQs
1. Is ADA currently oversold?
ADA is not technically oversold yet, but the RSI at 40.24 suggests it is nearing a point where buyers may step in.
2. What is the strongest support level now?
The lower Bollinger Band at $0.6879 is the key support zone, with secondary support at $0.6567.
3. What resistance must be broken to resume bullish momentum?
A clear breakout above the $0.7581 SMA is needed to confirm a bullish reversal.
4. Is $1.50 a realistic target in the near future?
Yes, $1.50 could be achieved in 2025 or 2026 if market sentiment shifts and Cardano’s network utility grows.
5. What are Cardano’s main growth drivers?
Scalability upgrades like Hydra, increased dApp deployment, staking, and global partnerships are key growth engines.
Also Read: XRP Dragon Predicts $3,000 Surge for XRP, Sparking Massive Community Buzz

