- Chainlink nears oversold territory, signaling potential rebound toward $25 soon.
- RSI and Bollinger Bands hint at bullish reversal for LINK.
- Chainlink eyes recovery as technical indicators point to market stabilization.
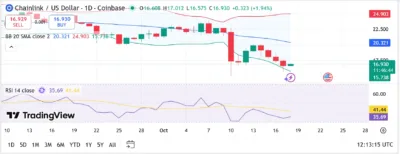
Bollinger Bands show that Chainlink (LINK) is currently trading near the lower band, signaling that the asset may be oversold and due for a potential recovery. The Relative Strength Index (RSI) also hovers at 35.69, suggesting that bearish momentum may be fading as buying pressure gradually increases. LINK faces immediate resistance at $17.50, while support is seen around $15.74. A decisive breakout above the $17.50 mark could propel the token toward the $20–$25 range.
At the time of writing, Chainlink trades at $16.93, reflecting a 1.94% gain over the past 24 hours after enduring several weeks of decline. The current rebound hints at improving sentiment in the broader altcoin market, especially as selling pressure begins to wane. Technical indicators suggest that LINK may be gearing up for a reversal if buyers can sustain momentum above key resistance levels.
Also Read: OpenSea Shifts Focus from NFTs to Multi-Chain Crypto Trading in Major Platform Overhaul
Technical Analysis
Bollinger Bands
Chainlink’s Bollinger Bands (20-day period) show the upper band positioned at $24.90, the middle band at $20.32, and the lower band around $15.74. With the current price hovering just above the lower band, LINK appears to be in an oversold region. Historically, similar setups have often preceded rebounds when market confidence improves and volume returns to the market.
If buyers can push the price above the middle band at $20.32, it would signal renewed strength and potentially mark the start of a short-term uptrend. A successful break above this zone could pave the way toward the upper band near $25. On the other hand, if the support level at $15.74 fails to hold, LINK may experience a deeper correction, possibly testing the $14.50 range before finding stability.
RSI Behavior
The Relative Strength Index currently sits at 35.69, with its moving average at 41.44. This indicates that Chainlink is approaching oversold territory, where sellers are typically exhausted, and new buyers begin to emerge. The gap between the RSI and its moving average also reflects lingering bearish pressure, but the declining momentum suggests that a reversal may be imminent.
If the RSI climbs above 40 in the coming sessions, it would signal growing bullish sentiment and possibly trigger a short-term upward move. A sustained push beyond 45 could confirm a transition into a more neutral or bullish phase, setting the stage for a broader recovery.
Support and Resistance Levels
Chainlink’s nearest support lies around $15.74, which aligns closely with the lower Bollinger Band. This level represents a crucial area where buyers may defend against further declines. On the upside, resistance is found near $17.50, followed by the middle Bollinger Band at $20.32. A break above these levels would validate a potential reversal and open the path toward $24.90, which corresponds to the upper Bollinger Band.
If LINK rebounds from the current support zone and closes consistently above $17.50, it could confirm the formation of a short-term bottom and signal renewed upward momentum. However, failure to hold the $15.70 area may invite additional selling pressure in the days ahead.

Source: Tradingview
Chainlink (LINK) Price Prediction 2025–2029
| Year | Minimum Price | Average Price | Maximum Price |
|---|---|---|---|
| 2025 | $15.00 | $20.00 | $25.00 |
| 2026 | $22.00 | $28.00 | $35.00 |
| 2027 | $30.00 | $38.00 | $45.00 |
| 2028 | $38.00 | $48.00 | $60.00 |
| 2029 | $50.00 | $65.00 | $80.00 |
2025
In 2025, Chainlink is projected to trade between $15.00 and $25.00 as it recovers from recent downward pressure. The oversold RSI and the position near the lower Bollinger Band suggest that selling activity may be tapering off, creating conditions for a rebound. If broader market sentiment improves, LINK could rally toward the $20–$25 range before the end of the year.
2026
By 2026, as the blockchain industry expands and decentralized applications increasingly rely on reliable oracle data, Chainlink could experience stronger adoption. This growth in utility may help LINK maintain an average price near $28.00, with potential highs around $35.00. Continued integration into DeFi protocols and enterprise systems would likely support a sustained uptrend.
2027
In 2027, steady growth across the DeFi and Web3 sectors could see Chainlink stabilizing around $38.00. The token’s use as an essential oracle provider in smart contract ecosystems could attract long-term investors, driving the price toward $45.00. Increased interoperability among blockchains and the continued evolution of tokenized assets could further strengthen LINK’s position.
2028
As decentralized finance, gaming, and metaverse integrations mature, Chainlink could gain significant traction by 2028. Institutional adoption and demand for accurate, real-world data may push LINK’s average trading range between $48.00 and $60.00. By this point, LINK could establish itself as a leading data infrastructure token in the global crypto market.
2029
By 2029, Chainlink may reach new all-time highs if the broader crypto market continues expanding. The token could trade near $65.00 on average, with potential peaks up to $80.00. A strong combination of technological relevance, enterprise adoption, and growing demand for oracle services could make LINK one of the top-performing assets in the crypto sector.
Conclusion
Chainlink currently trades near a critical support zone, showing early signs of recovery following a prolonged period of decline. The technical indicators — particularly the oversold RSI and the position near the lower Bollinger Band — suggest that the asset may be preparing for a rebound. If the price breaks convincingly above $17.50 and moves toward the $20.32 midpoint, LINK could gain momentum toward the $25 level.
Over the long term, as Chainlink continues to strengthen its role in blockchain infrastructure, the token may benefit from widespread adoption and positive market sentiment. These factors combined could help LINK achieve steady growth from 2025 through 2029.
FAQs
1. Why did Chainlink drop recently?
Chainlink’s recent decline was largely attributed to profit-taking and general weakness across the altcoin market. The token slipped below its 20-day moving average before stabilizing around the $15.74 support level.
2. Is Chainlink oversold right now?
With an RSI reading of 35.69, Chainlink is approaching oversold territory. This typically signals limited downside potential and hints at a possible rebound in the near term.
3. What is the next key resistance level?
The next significant resistance level for Chainlink stands at $17.50, followed by the middle Bollinger Band near $20.32. A sustained breakout above these points could open the way toward $25.00.
4. Can Chainlink reach $80 by 2029?
If adoption trends continue and Chainlink maintains its dominance as a leading oracle provider, it is plausible that LINK could reach $80.00 by 2029, supported by long-term market growth and enterprise integration.
5. Is Chainlink a good long-term investment?
Chainlink remains one of the most promising blockchain projects due to its critical role in connecting smart contracts with real-world data. While short-term volatility may persist, the project’s strong fundamentals make it a viable long-term speculative investment for those who believe in decentralized infrastructure.
Also Read: Ethereum’s Dankrad Feist Joins Tempo, a Payments-Focused Blockchain by Stripe and Paradigm
