


- Analyst ChartNerd says XRP may be building an ascending triangle — a bullish reversal pattern.
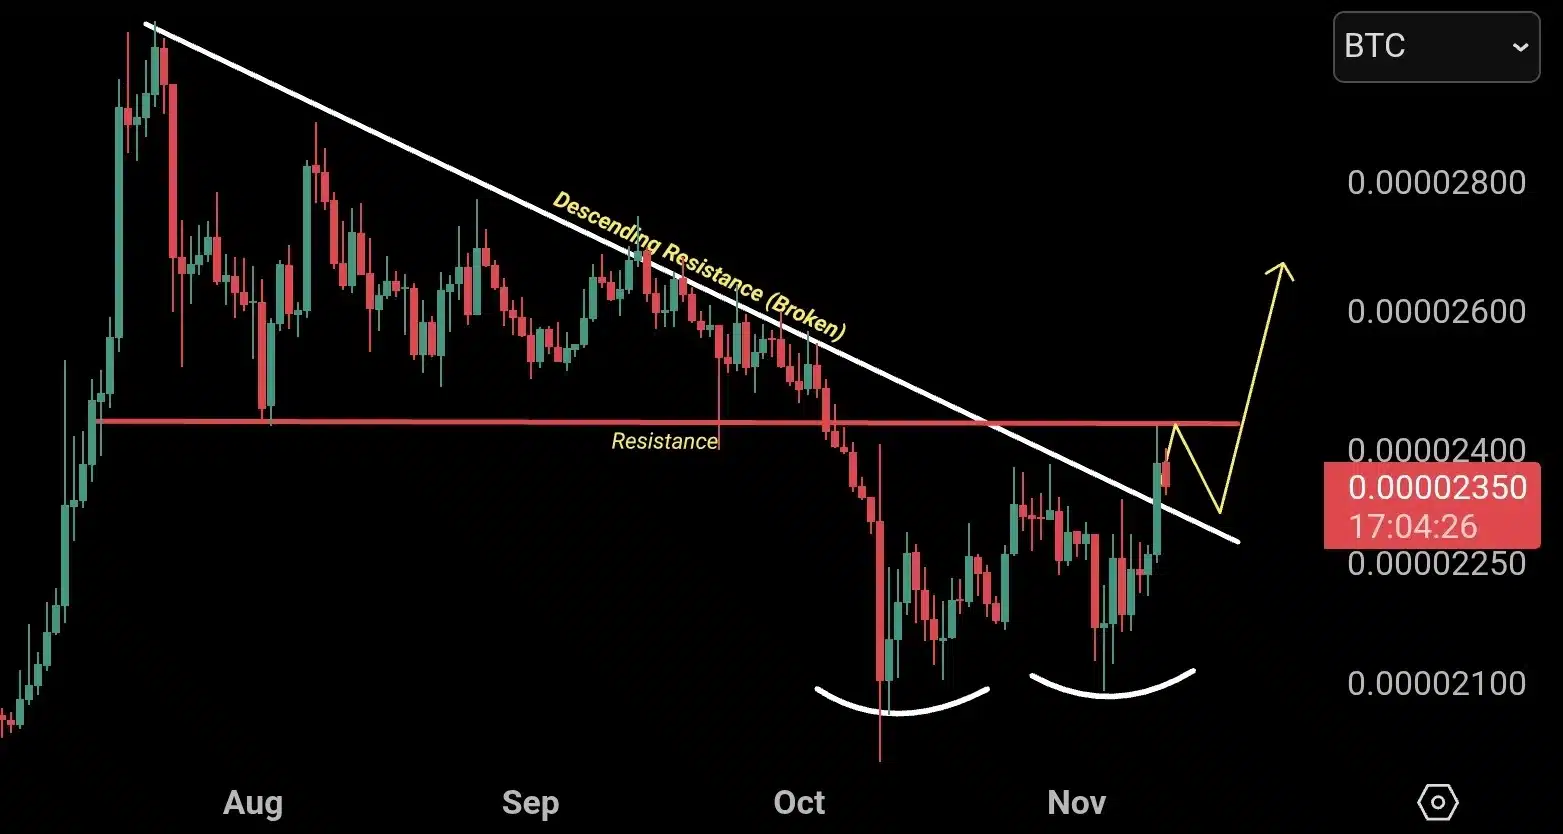
- The XRP/BTC pair has broken long-term descending resistance, now facing horizontal resistance near 0.00002350 BTC.
- ChartNerd emphasizes that $2.20–$2.30 remains the key support zone, with $2.70 as the next resistance to clear.
Crypto analyst ChartNerd, known for his technical breakdowns of XRP’s price action, says the digital asset may be forming a bottom reversal pattern after months of corrective movement. According to his latest analysis, XRP has already fulfilled the downside target of its descending triangle pattern that began after its all-time high.
The next potential setup, he says, could be an ascending triangle, a bullish structure signaling trend reversal, provided XRP can maintain support above $2.30.
“XRP placed an ATH and then formed a descending triangle (breakdown pattern). That breakdown target has been met. Now, $XRP has the chance to form an ascending triangle (bottom reversal pattern) if it can hold the line above $2.30. Breakout target = $3.20,” he wrote on X.
$XRP placed an ATH and then formed a descending triangle (breakdown pattern). That breakdown target has been met.
Now, $XRP has the chance to form an ascending triangle (bottom reversal pattern) if it can hold the line above $2.30.
Breakout target = $3.20
Check pinned tweet 🐦
— 🇬🇧 ChartNerd 📊 (@ChartNerdTA) November 11, 2025
XRP/BTC Pair Breaks Descending Resistance
In a follow-up tweet, ChartNerd highlighted the XRP/BTC trading pair, noting that it has broken its long-term descending resistance and is now encountering horizontal resistance, a normal retracement phase before further upside continuation.
Also Read: XRP Price at a Crossroads: Will $2.41 Hold or Is a Major Dip Coming Soon?
We're back on X.
— 36Crypto (@36Crypto1) August 21, 2026
Our previous account (36crypto2) is currently unavailable while we continue working through the appeal process. In the meantime, this is our new official account. While you are on this page, please support us by sharing and following.
An accompanying chart shared by the analyst shows XRP/BTC successfully breaching its multi-month downtrend line, confirming a technical breakout. However, price action has temporarily stalled at the 0.00002350 BTC level, where horizontal resistance sits.
Source: ChartNerd/X
“After breaking descending resistance, it has run into horizontal resistance and is seeing a pullback as expected. HL (higher low) is likely to form here. I gave you the heads up on the USDT pair coming in for ST retracement last night. The base is being built,” ChartNerd explained.
“The Base Is Being Built” — Eyes on $2.70 Resistance
The analyst reiterated that XRP’s short-term price structure remains intact and bullish, as long as it maintains higher lows above the $2.20–$2.30 region. He previously identified that zone as the bottom range, which has since held firm.
“XRP holders… Nerd called the bottom for $XRP between $2.20/$2, and so far, all is going well. The next stop is breaking $2.70 resistance, which I’ve tweeted about several times since the local lows. Once $2.70 (immediate resistance) is cleared, the pathway to ATH begins,” he said.
Technical Outlook
The confluence of factors, a confirmed breakout on the BTC pair, structural support above $2.30, and the potential formation of an ascending triangle, points to growing bullish momentum. If XRP can break and hold above $2.70, ChartNerd projects the next upside target at $3.20, which would signal a return toward its all-time high zone.
As XRP consolidates near key technical levels, analysts view the current phase as a crucial base-building stage ahead of what could be the next major leg upward in its market cycle.
Also Read: Uniswap’s Strategic Shift: New Fee Model and Governance Integration
