Ethereum products see $69 million in net inflows, marking the best result since March. Analyzing why this is not a silver lining for Ether.
While the Ethereum protocol boasts of promising updates, ETH keeps struggling below $3,700. The sharp downtick in social metrics adds an advantage for the bears, yet fundamentals spur optimism in Ether’s prospects. But which factors would be leading in the market sentiment?
Ethereum Deposits Emptying Despite Positive Address Momentum
Data from Glassnode indicates that the amount of Ether (ETH) held on exchanges has reached its lowest point in eight years.
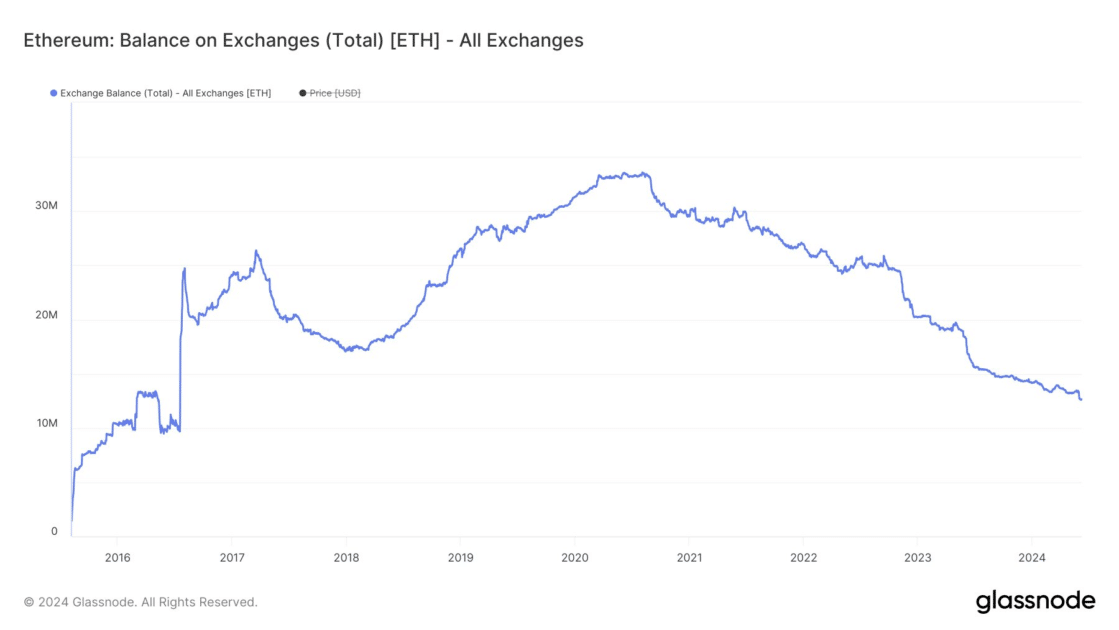
Ethereum: balance on exchanges (total). Source: Glassnode
While this may indicate a decreased speculative interest in Ether, taking place due to post-ETF approval market shock, this marks a strong holding tendency. According to IntoTheBlock’s data, 89% of Ethereum holders are in profit at the current price, which is a strong indicator of a healthy market.
Read Also: BlackRock’s latest S-1 filing adds more details about Ethereum ETF and its business prospects

Ethereum (ETH) trading activity. Source: IntoTheBlock
The data also reveals that Ethereum is mainly held by whales, with 51% of the assets cited to be concentrated in the large holders’ wallets. What is more, CoinShares recently reported that Ether investment products saw a total inflow of $69 million for the week, hitting a three-month record.
This correlates with a notable increase in the volume of transactions exceeding $100k, which proves the institutional and large-scale investor optimism on the long-term Ethereum perspectives due to its exchange-traded funds (ETFs) approval.
By contrast, overall Ethereum’s sentiment has registered a sharp decline since the beginning of the month. Santiment’s data reveals that Ether’s weighted sentiment indicates a negative rate after its surge at the end of May – just around the ETF-fueled spike.
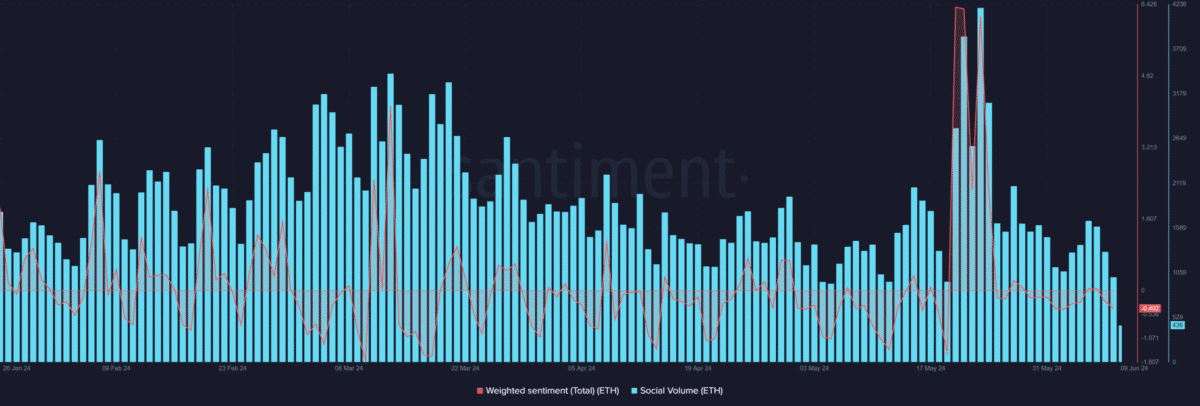
Ethereum: weighted sentiment and social volume. Source: Santiment
Additionally, an analysis of the social volume showed downticks corresponding to the decreases in weighted sentiment. Despite the weak sentiment, Ethereum still sees a positive new address momentum. At the writing time, the number of new addresses exceeds 105,000.
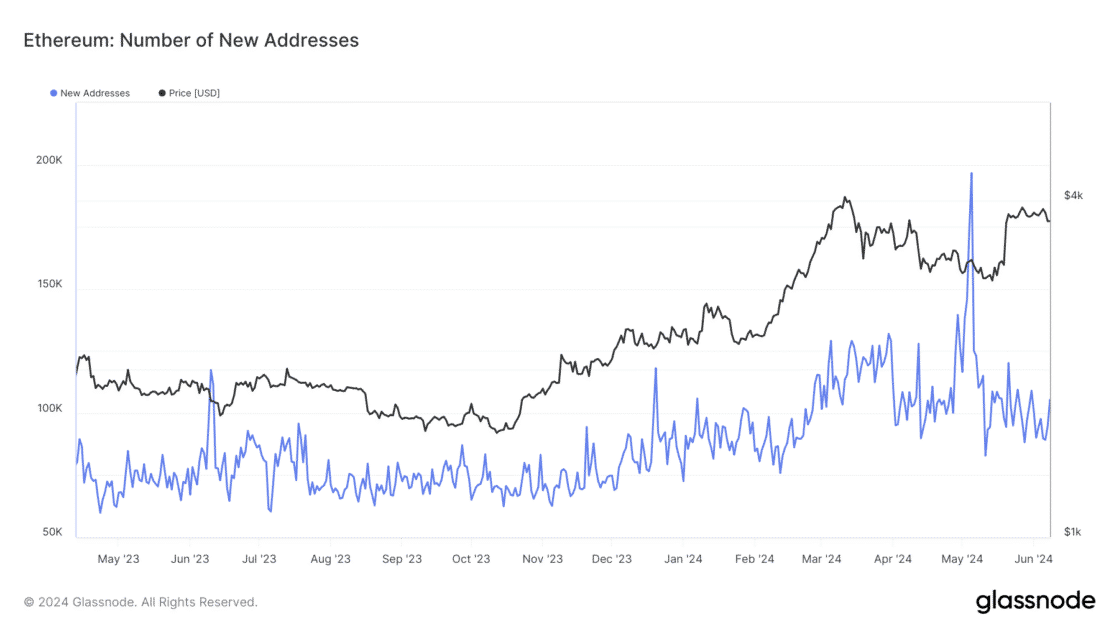
Ethereum: number of new addresses. Source: Glassnode
Read Also: XRP Whales Were Seen Active After the Price Drop, as They Moved 87M Coins
Chart Favors Bears
As per Ether’s daily chart, the asset faced heightened selling activity after a short period of consolidation near the $4,000 crucial resistance. This highlights the price level as a key point for short positions. Nonetheless, there is a significant support zone ahead, including the 100-day moving average at $3,431.05 and the 0.5 Fibonacci retracement level at $3,419. This suggests that the current price action may continue its bearish retracement in the short term, with the 100-day moving average and the 0.5 Fib level acting as primary support for buyers.
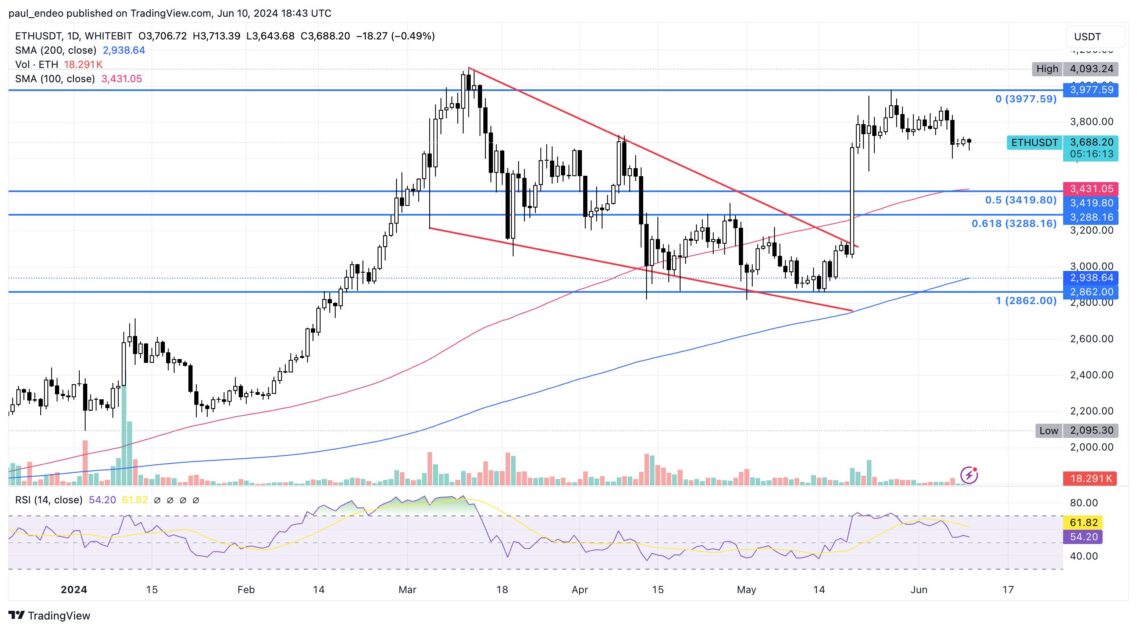
ETH/USDT 1D chart. Source: WhiteBIT TradingView
The 4-hour chart indicates a strong sideway movement for Ethereum. According to the graph, the aforementioned consolidation in the $4,000 area has formed a head-and-shoulders pattern, indicating a lack of bullish momentum and an increase in supply. Consequently, this pattern may signal an eventual bearish reversal, especially with breaking below the neckline of the formation.
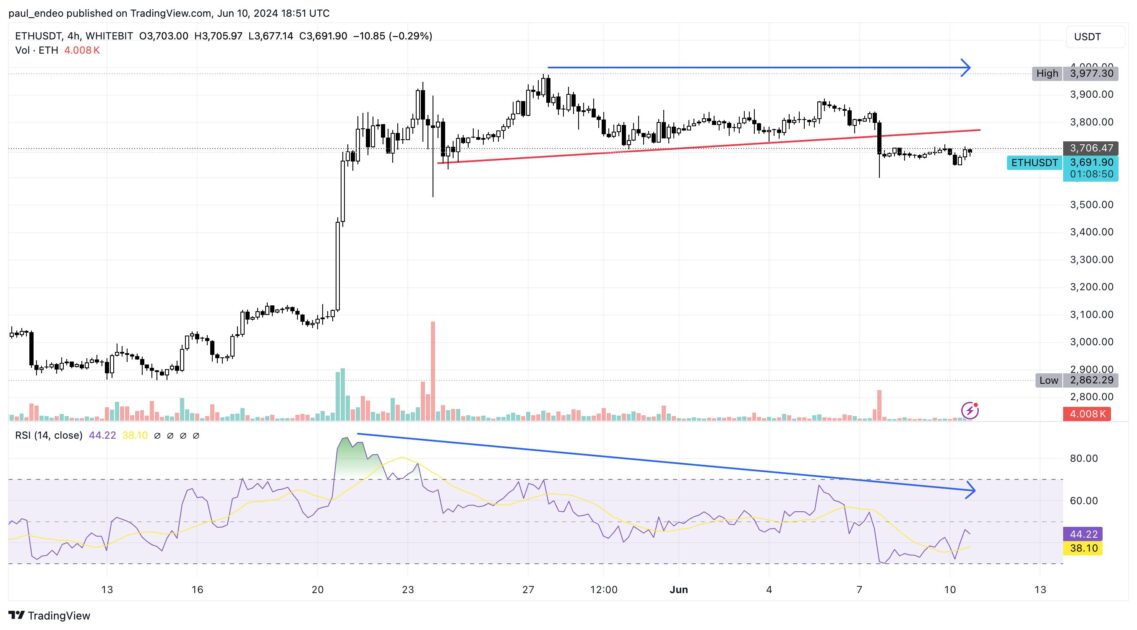
ETH/USDT 4h chart. Source: WhiteBIT TradingView
The seller dominance is also marked by a bearish divergence between the relative strength index (RSI) and the price movement. Currently, the price is at a critical support level of around $3.6K. If sellers manage to breach this pivotal level, continuing the bearish trend is the most likely outcome.
Controversial Ethereum updates only emphasize the vagueness of the coin’s trend. While traders received a perfect opportunity to buy, they should closely monitor the upcoming Federal Reserve’s updates on the interest rates in the US – a crucial factor of influence towards the cryptocurrency market.
Read Also: Paraguay to Sell Excess Hydro-Energy to Bitcoin Miners
