


Ethereum is under pressure as it trades near the $2,490 zone, showing clear signs of weakening momentum after a sharp rally earlier in the week. The price had surged from below $2,000 to a local high of $2,737 but has since struggled to sustain gains, with sellers stepping in near a major resistance band between $2,600 and $2,750.
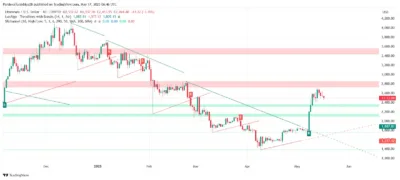
In the weekly chart, ETH regained the 0.236 Fibonacci level at $2,027 and reached as high as the 0.382 Fibonacci level at $2,424. Yet, this move triggered resistance, as the current weekly candle shows a long upper wick, showing that buyers are hesitant. Since this zone ($2,400–$2,500) was vital for consolidation in 2023, it is still a significant pivot point for the market.
Source: Tradingview
The increased volume from the bullish move above the trendline caused the price to rise, yet it could not sustain above $2,600. Prices were rejected above the Fib 0.5 level on May 14 and 15, returning ETH to a limited price range. Unless activity picks up soon, Ethereum may continue to fall.
Also Read: SEC Must Admit XRP Lawsuit Misstep to Sway Judge, Says Crypto Lawyer
Crucial Support Under Pressure as Indicators Flash Caution
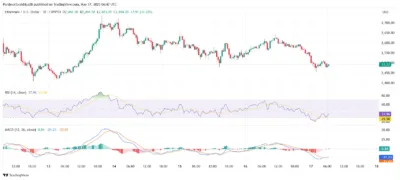
On the 4-hour chart, ETH has broken below the 20-EMA at $2,553 and is now hovering just above the 50-EMA at $2,450. This short-term support area is closely watched, as a clean break below it could signal a deeper retracement. A descending triangle pattern has also formed, further hinting at bearish pressure.
We're back on X.
— 36Crypto (@36Crypto1) August 21, 2026
Our previous account (36crypto2) is currently unavailable while we continue working through the appeal process. In the meantime, this is our new official account. While you are on this page, please support us by sharing and following.
Source: Tradingview
Meanwhile, technical indicators lean toward weakness, with the 30-minute RSI showing a bearish bias at 37.96. The MACD is still below its signal line, with the histogram staying flat, giving no clear indication of a reversal. Moreover, ETH is trading below the Ichimoku Cloud and Tenkan-Sen, suggesting a higher risk of going down over the following few trading periods.
Should Ethereum break below $2,450, the following primary levels are at $2,300 and $2,265, key points on the 100-EMA and an earlier area where it broke out. If bulls manage to retain this level, there is a possibility of a rise toward $2,600 and $2,745 afterward.
Ethereum’s price is still unstable as May 18 approaches, with the key support of $2,450 being tested. Traders must keep an eye on this level because it can decide whether ETH goes on a new rise or triggers a more significant fall.
Also Read: XRP Poised for Takeoff? New Pattern Hints at Major Jump to $3.33
