


What to Know
- HYPE fell to $86.07, slipping below its rally’s supporting moving average and trading approximately 12% beneath its $98 local peak.
- Momentum weakened as the relative strength index approached 50, while declining trading volume highlighted reduced participation compared with August’s breakout.
- Rising averages place support around $81 to $82, while buyers need to reclaim $88 to $90 to challenge the breakdown.
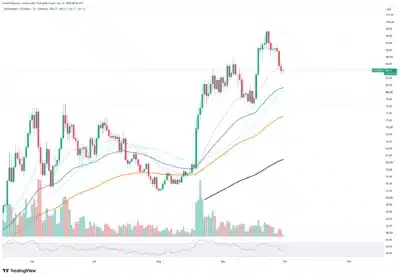
Hyperliquid’s HYPE token faces a potential test of $81 to $82 support following a breakdown below its rally’s key moving average. At the reported chart reading, HYPE traded at $86.07, leaving the token approximately 12% below its local peak near $98.
According to Tradingview chart analysis, daily candles slipped beneath the short-term moving average that supported the advance beginning in August. Consequently, buyers must recover the $88 to $90 area before the chart offers stronger evidence that the recent breakdown has reversed.
During the preceding advance, the short-term average repeatedly attracted buyers, including a September recovery from roughly $75 that reinforced its importance. However, recent candles show HYPE struggling around that same indicator, suggesting buyers have lost the support that previously helped sustain momentum.
Following the peak near $98, successive lower highs weakened the price structure, while one substantial red candle erased several sessions’ gains. Together, these developments suggest weakening buyer control, although the rising longer-term averages still provide support beneath the current trading level.
Meanwhile, the relative strength index retreated toward 50 from higher readings, placing momentum near neutral territory rather than indicating oversold conditions. This reading suggests the earlier buying strength has faded, but it does not independently establish how far the pullback might extend.
We're back on X.
— 36Crypto (@36Crypto1) August 21, 2026
Our previous account (36crypto2) is currently unavailable while we continue working through the appeal process. In the meantime, this is our new official account. While you are on this page, please support us by sharing and following.
Additionally, trading volume declined through September, contrasting with the heavier participation that accompanied the August breakout and helped establish the advance. Moderate activity accompanied the recent selling, offering limited evidence of panic while also revealing weaker participation than during the initial breakout.
Also Read: SUI Eyes $4 as Ali Charts Flags Golden Cross Following Two Rallies Above 200% Gains
Rising Moving Averages Put $81 to $82 Support at the Center of HYPE’s Pullback
Against that backdrop, the next notable support area sits around $81 to $82, where two rising moving averages converge beneath HYPE. Holding this zone would preserve an important cushion for buyers, while a breakdown would expose lower areas identified in the analysis.
Below that convergence, the September low around $75 to $78 offers another reference point for assessing whether buyers can stabilize prices. Moreover, a longer-term average near $73 provides deeper support, followed by another rising indicator around $61 if selling pressure strengthens considerably.
Source: Tradingview
Despite the near-term deterioration, the longer-term averages remain upward-sloping and retain their bullish alignment, keeping the broader structure comparatively more constructive. However, that alignment does not eliminate downside risk, especially while HYPE remains unable to reclaim the indicator that previously supported pullbacks.
On the upside, recovering $88 to $90 would challenge the breakdown, although the earlier peak near $98 remains above that area. For now, HYPE’s chart combines weaker near-term momentum with rising support below, making the next price reaction around those averages significant.
Also Read: Gemini Founder Compares Zcash Enthusiasm to Crypto’s 2019 Recovery
