


Hyperliquid (HYPE) is showing strong signs of recovery, with the price rebounding from the $39.20 demand zone and currently trading at $42.50. After a solid bounce from the $36.50 support on June 12, the token has entered a bullish consolidation phase, reclaiming key exponential moving averages and attracting increased buy-side interest.
Price action is now retesting resistance near the $44.22 supply zone, a level that has repeatedly rejected bullish advances. With the Keltner Channel expanding and momentum building, investors are watching closely to see whether Hyperliquid can finally break through and target the $47.00–$47.50 range.
Also Read: Polygon Price Prediction 2025–2029: Can POL Hit $0.225 Soon?
Technical Analysis
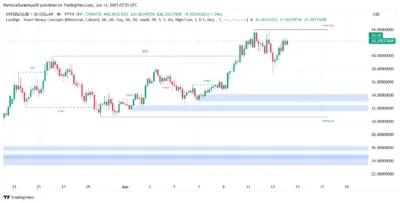
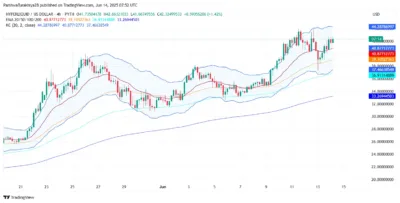
On the 4-hour timeframe, Hyperliquid has decisively reclaimed the short-term 20-, 50-, and 100-period exponential moving averages. The 20 EMA is now curving upward around $40.87, suggesting the return of bullish momentum. The Keltner Channels are also widening, a classic signal of rising volatility and potential for an impulsive breakout move.
Volume profile analysis reinforces this view, showing clear buy-side activity clustered above the $39.20 demand zone. Notably, visible support is forming around $41.60, with a high-volume value area near $42.10 adding strength to this consolidation.
Bolstering the bullish argument, Smart Money Concepts have shown several Breaks of Structure (BOS) since June 7, along with a clean Change of Character (CHoCH). This sort of structural signals acceleration by more complex market players.
We're back on X.
— 36Crypto (@36Crypto1) August 21, 2026
Our previous account (36crypto2) is currently unavailable while we continue working through the appeal process. In the meantime, this is our new official account. While you are on this page, please support us by sharing and following.
Source: Tradingview
The longer the price keeps making higher lows and squeezing under the resistance at $44.22, marked as a weak high, the more likely it is that a liquidity sweep or breakout to the upside will occur.
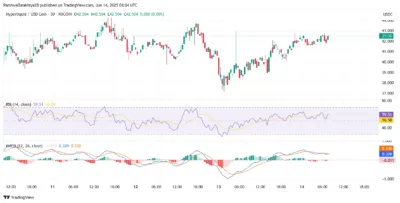
Supported by momentum indicators, the uptrend is further evidenced by the 30-minute Relative Strength Index (RSI) rising to 59.51, indicating that short-term momentum is improving but not yet overbought. The Moving Average Convergence Divergence (MACD) has crossed bullishly and its histogram is widening in the positive region- which indicates the increasing strength of the buyers.
Source: Tradingview
The 4-hour chart Volume-Weighted Average Price (VWAP) is $42.13, and the price is above the VWAP. It is a positive indication that the higher range is being digested by the market and considered as fair value.
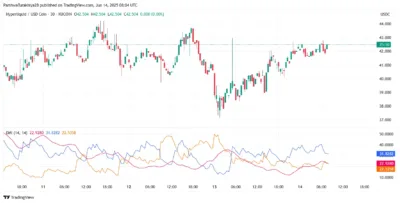
In the meantime, the Directional Movement Index (DMI) is showing a bullish trend developing: the +DI line is crossing the –DI powerfully, and the Average Directional Index (ADX) is starting to rise, indicating the development of a long-term directional move.
Source: Tradingview
Critical Resistance and Near-Term Scenarios
If Hyperliquid successfully breaks and closes above the $44.22 resistance on strong volume, it could trigger a rapid move toward $47.50, especially considering the low overhead supply in that price region. However, if the price faces rejection at this level, a short-term pullback is likely.
In that case, HYPE could revisit the VWAP and 20 EMA support cluster near $40.80. A deeper correction could even bring price back into the demand block spanning $39.20 to $36.56, though this would weaken the bullish setup.
Source: Tradingview
Bullish or Bearish: What Lies Ahead for Hyperliquid?
As long as HYPE holds above the mid-channel support and demand cluster at $39.20, the bullish structure remains intact. The ascending channel on the daily chart has been respected since April, and the token is now hugging the upper band—often a prelude to breakout continuation.
However, failure to take out the $44.22 high may delay the next leg up. Volatility is rising, and as long as buyers defend the $41.60–$42.10 support band, bulls are favored in the near term.
Hyperliquid Price Forecast Table: 2025–2029
| Year | Minimum Price | Average Price | Maximum Price |
| 2025 | $36.50 | $44.00 | $48.00 |
| 2026 | $41.00 | $49.00 | $54.50 |
| 2027 | $46.20 | $55.00 | $62.00 |
| 2028 | $50.00 | $60.00 | $70.00 |
| 2029 | $55.00 | $66.50 | $78.00 |
Yearly Outlook
2025
With the ascending channel holding since April and momentum rising, HYPE could close the year near the $47.50 resistance if it clears $44.22.
2026
Institutional interest and broader adoption of decentralized trading platforms could push the average price to $49.00, with breakouts potentially reaching $54.50.
2027
If Hyperliquid expands liquidity and user base, it may attract major capital flows, driving price toward $62.00.
2028
Further improvements to protocol scalability and integration could boost market cap and price potential, bringing $70.00 into play.
2029
If Hyperliquid cements itself as a core DEX infrastructure, its price could reach a peak of $78.00, assuming strong market and ecosystem growth.
Conclusion
Hyperliquid’s price is showing clear technical strength, with bullish indicators flashing across multiple timeframes. The $44.22 resistance is the final obstacle before a potential breakout to $47.00–$48.00. Should bulls maintain control, the token may mark new yearly highs. However, any failure to hold the $41.60 support area could invite another round of consolidation.
FAQs
1. Why is the Hyperliquid (HYPE) price rising today?
It rebounded from the $39.20 demand block, reclaimed the EMA cluster, and is now testing $44.22—fueled by bullish momentum and Smart Money accumulation.
2. What’s the next key resistance level for HYPE?
The $44.22 zone is critical; a breakout above it could open the path to $47.50.
3. What happens if HYPE drops below $41.60?
It may retest the support zone at $40.80 or fall further into the $39.20–$36.50 demand range.
4. Is HYPE currently overbought?
Not yet. RSI is at 59.51—strong, but not extreme.
5. Can Hyperliquid hit $47.50 in 2025?
If price breaks $44.22 with volume confirmation and bulls hold key support, $47.50 is a realistic near-term target.
Also Read: Michael Saylor Predicts Bitcoin Will Hit $1 Million After Sharp Price Rebound
