


What to Know:
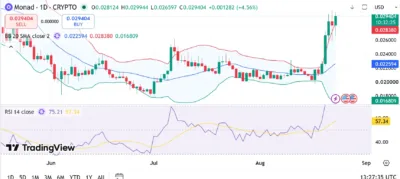
- MON trades near $0.029404, exceeding the upper Bollinger Band at $0.028380 as buyers drive a powerful breakout above resistance.
- RSI stands at 75.21, confirming strong buying momentum but warning that MON has entered overbought territory following its rapid rally.
- Holding $0.028380 could support further gains, while sustained adoption and market demand may eventually push MON toward the $0.10 target.
Monad (MON) has recorded a powerful bullish breakout on the daily chart, with the token trading around $0.029404 following a 4.56% gain. Price has climbed above the upper Bollinger Band at $0.028380, reflecting aggressive buying pressure and a substantial expansion in volatility.
The 14-day Relative Strength Index (RSI) stands at 75.21, while its moving average is approximately 57.34. Momentum is firmly bullish, although the RSI has entered overbought territory above 70, increasing the possibility of temporary consolidation or a price correction.
Also Read: Anoma (XAN) Price Prediction 2026–2030: Can XAN Hit $0.10?
MON Breakout Pushes Price Above Upper Bollinger Band
MON has broken decisively above the upper Bollinger Band at $0.028380 following an extended consolidation around the $0.020000–$0.022000 range. The advance produced several large bullish candles, showing that buyers gained control and forced the token beyond its recent trading boundaries.
Maintaining support above $0.028380 could allow MON to challenge the psychological $0.030000 level. A confirmed daily close above this region would strengthen the breakout and potentially place the earlier chart highs around $0.032000 within reach.
We're back on X.
— 36Crypto (@36Crypto1) August 21, 2026
Our previous account (36crypto2) is currently unavailable while we continue working through the appeal process. In the meantime, this is our new official account. While you are on this page, please support us by sharing and following.
However, prices trading outside the upper Bollinger Band can indicate that a rally has become stretched. Profit-taking around $0.030000 could therefore return MON toward $0.028380, which may act as the first support area during a pullback.
The middle Bollinger Band stands at $0.022594 and represents a more important underlying support level. Losing the breakout zone could expose this moving average, while a deeper decline would shift attention toward the lower Bollinger Band near $0.016809.
RSI Signals Strong but Overextended Momentum
MON’s RSI reading of 75.21 confirms that buying momentum has accelerated considerably. The indicator also sits well above its moving average at 57.34, supporting the bullish price structure visible across the latest daily candles.
Nevertheless, an RSI above 70 commonly indicates overbought market conditions. This does not guarantee an immediate reversal, as strongly trending assets can remain overbought for extended periods, but it warns traders against assuming that the rally will advance without pullbacks.
Consolidation above $0.028380 would allow momentum to cool while preserving the breakout. Conversely, an RSI decline below 70 combined with price falling beneath the upper band could signal that short-term sellers are regaining influence.
Source: Tradingview
Monad (MON) Price Prediction 2026–2030
| Year | Minimum | Average | Maximum |
|---|---|---|---|
| 2026 | $0.0180 | $0.0300 | $0.0400 |
| 2027 | $0.0250 | $0.0410 | $0.0550 |
| 2028 | $0.0340 | $0.0550 | $0.0700 |
| 2029 | $0.0450 | $0.0700 | $0.0880 |
| 2030 | $0.0580 | $0.0820 | $0.1000 |
Price Forecast by Year
2026
Holding above $0.028380 and converting $0.030000 into support could help MON extend its breakout toward approximately $0.0400. Failure to preserve the breakout may trigger a correction toward $0.022594 or lower.
2027
Establishing a stable structure above $0.0400 could attract stronger market participation and allow buyers to target approximately $0.0550. This outlook depends heavily on broader cryptocurrency conditions and continued interest in the Monad ecosystem.
2028
Sustained network growth, increasing adoption and a pattern of higher price lows could support an advance toward $0.0700. MON would still need to overcome several psychological resistance levels during this projected expansion.
2029
If buyers preserve the broader bullish structure and Monad gains stronger demand, MON could approach approximately $0.0880. Market volatility may produce substantial corrections even if the longer-term trend remains positive.
2030
Continued adoption and favorable cryptocurrency market conditions could place the psychological $0.10 level within reach. From $0.029404, reaching $0.10 would require an increase of approximately 240%.
Conclusion
Monad is displaying strong bullish momentum, with MON trading near $0.029404 and breaking above the upper Bollinger Band at $0.028380. The breakout follows a prolonged consolidation period and shows that buyers have established control over the immediate price structure.
The RSI reading of 75.21 supports the bullish outlook but also highlights overbought conditions. Holding $0.028380 could preserve momentum toward $0.030000 and $0.032000, while losing this level may encourage a correction toward the middle Bollinger Band at $0.022594.
Reaching $0.10 by 2030 remains a speculative scenario rather than a guaranteed outcome. MON would require sustained ecosystem adoption, favorable market conditions and successful breaks through several major resistance zones to achieve that target.
FAQs
1. Is MON currently bullish?
MON is technically bullish because price has broken above the upper Bollinger Band, supported by strong momentum and several large daily candles.
2. What is the key resistance level for MON?
Immediate resistance stands around the psychological $0.030000 level, followed by the earlier chart region near $0.032000.
3. What are the important MON support levels?
The upper Bollinger Band at $0.028380 provides immediate support, while $0.022594 and $0.016809 represent deeper technical support areas.
4. Can MON reach $0.10 by 2030?
MON could potentially reach $0.10 under a sustained long-term bullish scenario, requiring approximately 240% growth from its current chart price.
5. What could weaken the MON price outlook?
A fall below $0.028380, declining momentum, reduced ecosystem demand and wider cryptocurrency market weakness could undermine the bullish price outlook.
Also Read: Ontology (ONT) Price Prediction 2026–2030: Can ONT Hit $0.10?
