

What to Know
-
Origin Protocol trades near $0.02935, above its Bollinger Band midline, although recent selling pressure has weakened the earlier bullish momentum.
-
OGN’s RSI stands at 53.74, indicating moderately positive momentum, while its position below the signal average suggests weakening buying strength.
-
Breaking above $0.04275 could support further recovery, while losing $0.02824 would increase downside risks and expose lower support levels.
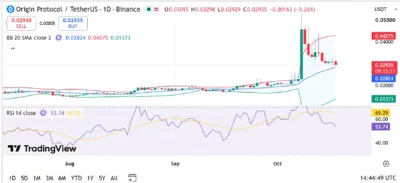
Origin Protocol (OGN) trades near $0.02935, with its daily chart showing a substantial correction following a strong October rally. According to TradingView, OGN remains above its 20-day Bollinger Band average at $0.02824, although recent selling pressure has pushed prices considerably below the upper band at $0.04275.
Recent candles indicate weakening buying momentum following a rapid price increase that briefly lifted OGN above $0.045. The subsequent correction brought prices toward $0.029, where buyers are attempting to maintain support.
The Relative Strength Index stands at 53.74, below its moving average of 65.25 but above the neutral threshold of 50. These readings suggest that bullish momentum has weakened considerably, although sellers have not established complete control. OGN is the governance and value-accrual token associated with Origin Protocol’s decentralized finance ecosystem.
Also Read: Richard Heart Detained in Turkey as Police Seize $7.15 Million and Six Crypto Wallets
Market Structure and Price Action
Origin Protocol’s daily chart shows relatively stable trading throughout July and August, with prices largely fluctuating between $0.015 and $0.020. Buying activity gradually strengthened during September, allowing OGN to establish higher trading levels before October’s substantial breakout.
The rally pushed OGN above $0.045, marking a significant departure from its earlier consolidation range. Nevertheless, profit-taking subsequently triggered several bearish candles, bringing prices toward the $0.029 region.
We're back on X.
— 36Crypto (@36Crypto1) August 21, 2026
Our previous account (36crypto2) is currently unavailable while we continue working through the appeal process. In the meantime, this is our new official account. While you are on this page, please support us by sharing and following.
Despite this correction, OGN remains slightly above its Bollinger Band midline at $0.02824, which represents an important support reference. Maintaining this level could allow buyers to stabilize prices and attempt another recovery.
A sustained breakdown below $0.02824 would weaken the current structure and potentially expose support around $0.025 and $0.020. Conversely, renewed buying pressure could lift OGN toward $0.033, followed by resistance near $0.040.
Bollinger Bands Indicate Elevated Volatility
OGN trades above its Bollinger Band midline at $0.02824, suggesting that its broader recovery structure remains intact despite the recent correction. The narrow distance between the current price and middle band indicates that buyers face an important test.
The upper Bollinger Band stands at $0.04275, while the lower band remains near $0.01373. This considerable separation reflects increased volatility following October’s substantial price movement.
A sustained recovery above $0.033 could strengthen bullish expectations and potentially expose resistance around $0.040 and $0.04275. Breaking above these levels would improve the possibility of advancing toward $0.050.
Reaching the psychological $0.10 target would require an increase of approximately 241% from the displayed price, making sustained buying pressure and stronger market participation essential.
Bollinger Bands adjust as trading conditions change, meaning their current values serve as technical reference points rather than guaranteed future price targets.
RSI Signals Weakening Bullish Momentum
The RSI reading of 53.74 indicates moderately positive momentum, although its position below the moving average of 65.25 suggests that buying strength has declined. The indicator previously approached overbought territory during October’s rally before retreating toward neutral levels. This movement corresponds with the correction visible in OGN’s recent daily candles.
An RSI recovery above 60 could indicate strengthening demand and support another attempt to challenge nearby resistance levels. Conversely, a sustained decline below 50 would suggest that selling pressure is increasing. For OGN to establish a stronger bullish outlook, buyers would need to defend the $0.02824 support level while pushing the RSI toward higher readings.
Source: TradingView
OGN Price Predictions (2026–2030)
| Year | Minimum Price | Average Price | Maximum Price |
|---|---|---|---|
| 2026 | $0.020 | $0.035 | $0.050 |
| 2027 | $0.025 | $0.045 | $0.070 |
| 2028 | $0.030 | $0.060 | $0.090 |
| 2029 | $0.040 | $0.075 | $0.120 |
| 2030 | $0.050 | $0.100 | $0.150 |
Yearly Insights
2026
OGN’s remaining 2026 outlook depends on maintaining support around $0.02824 and overcoming resistance near $0.033. A sustained breakout could support an advance toward $0.040–$0.050, while renewed selling pressure could expose the $0.020 region.
2027
Improving cryptocurrency market conditions and stronger demand for Origin Protocol’s services could support a recovery toward $0.070. Establishing support above $0.040 would strengthen this scenario, although weaker market participation could restrict prices to lower trading ranges.
2028
A broader cryptocurrency market expansion could allow OGN to challenge $0.090. Reaching this level would require sustained buying activity, improving liquidity, and greater adoption of Origin Protocol’s decentralized finance products.
2029
The bullish scenario places OGN near $0.120 if stronger ecosystem participation and favorable market conditions support additional demand. Limited adoption or prolonged bearish conditions could instead keep prices around substantially lower levels.
2030
A favorable long-term scenario allows OGN to approach $0.150, supported by broader cryptocurrency adoption and sustained activity within Origin Protocol’s ecosystem. Nevertheless, the current daily chart does not provide technical confirmation or a reliable timetable for reaching this valuation.
Conclusion
Origin Protocol maintains a moderately bullish technical structure, with its price trading above the Bollinger Band midline at $0.02824 and RSI standing at 53.74. Nevertheless, recent bearish candles indicate that buying momentum has weakened following October’s substantial rally.
A sustained recovery above $0.033 could support another challenge of $0.040 and $0.04275, potentially opening a path toward $0.050. Reaching $0.10 would require a much stronger and sustained advance, while losing support around $0.02824 could increase the possibility of a deeper correction.
FAQs
1. What is the immediate support level for OGN?
The nearest support reference is the Bollinger Band midline at $0.02824, followed by potential support around $0.025 and $0.020.
2. What is the next major resistance for OGN?
OGN faces immediate resistance around $0.033, followed by $0.040 and the upper Bollinger Band at $0.04275. A breakout above these levels could expose $0.050.
3. What does OGN’s RSI indicate?
The RSI reading of 53.74 indicates moderately positive momentum. Nevertheless, its position below the 65.25 moving average suggests that buying strength has weakened following the recent rally.
4. Can OGN reach $0.10 before 2030?
OGN could reach $0.10 under favorable market conditions, although achieving this target would require approximately 241% growth from its displayed price. Sustained buying pressure, stronger liquidity, and improved market sentiment would be necessary.
5. Why is the Bollinger Band midline important?
The Bollinger Band midline at $0.02824 represents OGN’s 20-day moving average and helps identify the prevailing short-term trend. Maintaining prices above this level could support another recovery, while falling below it would suggest increasing bearish pressure.
Also Read: Pumpcade (PUMPCADE) Price Prediction 2026–2030: Can PUMPCADE Hit $0.05 Soon?
