


- PUMP price nears resistance as traders anticipate possible breakout move.
- Market compression signals volatility ahead with EMA levels converging tightly.
- Buyers defend support, but outflows show investors remain highly cautious.
Pump. fun’s native token PUMP traded at $0.00321 today as price action squeezed between a descending resistance trendline and a firm support base. The token has established a symmetrical triangle in the past two weeks, which is an indication that volatility might re-emerge as the structure approaches its apex.
Attempts to break out above the $0.00400 level earlier in the month were unsuccessful, resulting in profit-taking that dragged the price downwards. Nevertheless, buyers have been keen to defend the $0.00275 to $0.00285 zone, which has helped the token avoid deeper declines and maintain consolidation.
Also Read: Virtuals Protocol (VIRTUAL) Price Prediction 2025–2029: Can VIRTUAL Hit $5.00?
Technical Conditions Tighten Around Resistance
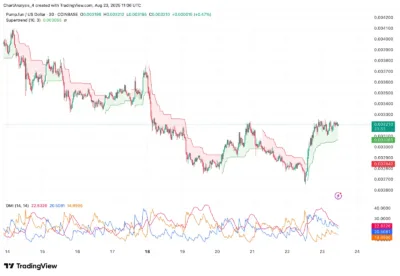
Short-term momentum indicators highlight improving sentiment. According to TradingView data, the RSI on the 30-minute chart now sits above 55, suggesting buying strength after a rebound from oversold conditions earlier this week. The Supertrend indicator has also signaled a bullish move just above the $0.00306 price, and VWAP indicators also show that buyers are maintaining the market above the session’s averages.
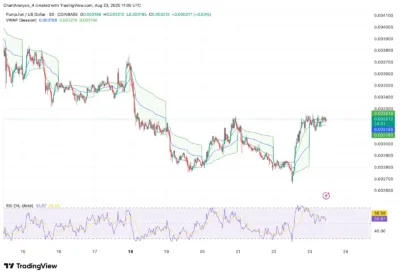
Source: Tradingview
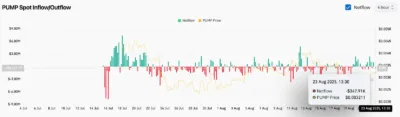
On-chain activity tells a different story, however. According to Coinglass, the total net spot outflow was $347,910 on August 23, as retail and mid-sized accounts continued to reduce their exposure. This will drag the possible speed of gains despite the technical recovery indicators.
We're back on X.
— 36Crypto (@36Crypto1) August 21, 2026
Our previous account (36crypto2) is currently unavailable while we continue working through the appeal process. In the meantime, this is our new official account. While you are on this page, please support us by sharing and following.
Source: Coinglass
Market Compression Signals Breakout Potential
On the four-hour chart, Bollinger Bands have compressed between $0.00272 and $0.00329, confirming suppressed volatility ahead of a breakout. In the meantime, EMAs between $0.00305 and $0.00337 form a cluster that creates a squeeze zone when a breakdown or an upswing can soon be determined.
Directional Movement Indexes are at-par, as DI is above +DI, but a climbing ADX indicates a mounting trend strength that has not been to the liking of bulls.
Short-Term Price Outlook
The key level to watch remains resistance at $0.00335. A breakout above this level could prompt a rally to the next barrier of $0.00355 and $0.00380, which buyers could not push higher in the past. Trading above EMA200 at $0.00337 would be a bullish sign.
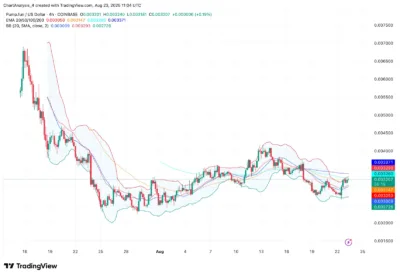
Source: Tradingview
Failure to sustain at $0.00305 may pull PUMP back to the lower level of $0.00285 with downward pressure on the subsequent levels of $0.00265. Volume confirmation will be necessary to confirm the direction of the breakout.
The price action of PUMP keeps trading in a narrowing range, leaving the market on breakout watch. Bulls need to reclaim $0.00335 convincingly to tilt momentum in their favor, while sellers remain in control below $0.00305.
Also Read: SKALE (SKL) Price Prediction 2025–2030: Can SKL Hit $0.129 Soon?
