


What to Know
- Shiba Inu recorded a 440.65% increase in eight-hour spot flows despite negative hourly balances and a three-day net outflow total.
- Futures net flows remained negative across most measured periods, with the 12-hour window recording approximately $433,240 in net capital outflows.
- SHIB traded near $0.00000550, below its long-term moving average, as support between $0.00000540 and $0.00000545 became the immediate technical test.
Shiba Inu buyers face renewed selling pressure as negative short-term capital flows overshadow a 440.65% increase in eight-hour spot flows. SHIB trades near $0.00000550, falling below a long-term moving average despite positive net inflows across several longer intraday periods.
Spot-market figures show eight-hour net inflows reached approximately $506,680, while the four-hour reading climbed 337.15% to $394,170. Across the 12-hour window, SHIB registered another positive balance of $352,220, adding to the stronger readings across these periods.
Its 24-hour figures also favored inflows, with $6.72 million entering the spot market against $6.11 million leaving. Those movements produced approximately $613,500 in positive net flows, placing the daily balance above the shorter negative readings.
Still, the latest hourly figures show outflows overtaking inflows, reversing the direction recorded across the longer intraday windows. During that hour, SHIB attracted $211,140 in spot inflows but recorded $247,370 in outflows, leaving a $36,230 deficit.
Another negative reading appeared across the 30-minute window, where net outflows reached approximately $26,830, reinforcing the weaker hourly balance. Beyond these intraday changes, the three-day balance remained negative by roughly $388,160, contrasting with the positive 24-hour total.
We're back on X.
— 36Crypto (@36Crypto1) August 21, 2026
Our previous account (36crypto2) is currently unavailable while we continue working through the appeal process. In the meantime, this is our new official account. While you are on this page, please support us by sharing and following.
The figures place SHIB’s eight-hour improvement alongside net outflows across both shorter trading windows and the broader three-day period. They also show why the 440.65% increase represents one trading window rather than a uniform improvement across every measured period.
Also Read: AI Stock Rally Sends S&P 500 and Nasdaq to Records as Onchain Equity Access Expands
Negative Futures Flows Accompany SHIB’s Loss of Moving Average Support
Futures-market figures add another weak reading, with negative net flows appearing across most of the listed trading periods. These include the five-minute, 15-minute, 30-minute, one-hour, four-hour and 12-hour windows, while only the eight-hour period remained marginally positive.
Across the 12-hour futures window, net outflows reached $433,240, contrasting with positive spot flows over the same period. That divergence leaves the stronger spot reading without a matching positive balance in the corresponding futures-market window.
Meanwhile, SHIB’s price declined from around $0.00000580 to $0.00000550, giving back ground gained during its September recovery. Sellers pushed the token below its long-term moving average near $0.00000565, removing a technical level reclaimed during that recovery.
Attention now turns to the $0.00000540–$0.00000545 support range, which sits directly beneath the token’s reported trading price. Holding this range could allow buyers to challenge $0.00000560 before attempting a broader recovery toward $0.00000580–$0.00000600.
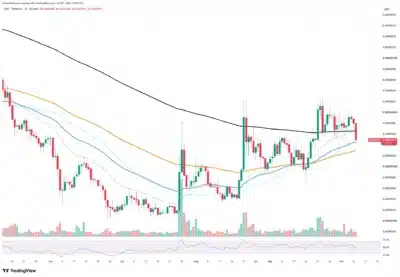
Source: Tradingview
A move toward those higher levels would require SHIB to recover ground around the moving average it recently lost. Conversely, a break below $0.00000540 could expose $0.00000520, with the psychologically important $0.00000500 level representing another downside reference.
These price levels frame the next potential moves while spot and futures flows show uneven demand across measured periods. SHIB’s positive eight-hour spot balance remains the strongest headline figure, but shorter-term outflows and negative futures readings temper that improvement. Its price also remains below the cited moving average, with support at $0.00000540–$0.00000545 marking the immediate technical test.
Also Read: Securitize Adds ADI Chain as UAE Targets Wider Access to Tokenized Investments
