

What to Know
- Solana’s failed $100 breakout leaves $89 as the crucial support level for preserving its broader bullish recovery structure.
- Elevated RSI and heavy long positioning expose SOL to further liquidations if sellers push the cryptocurrency below key support.
- Stronger trading volume supports the recovery, but a daily close beneath $89 could expose SOL to significantly deeper losses.
Solana’s failed attempt to hold above $100 has placed the $89 support zone at the center of its broader recovery, giving traders a critical level to watch. SOL briefly moved above $102 before sellers pushed the token back toward $97, weakening the immediate breakout while leaving its wider recovery structure intact.
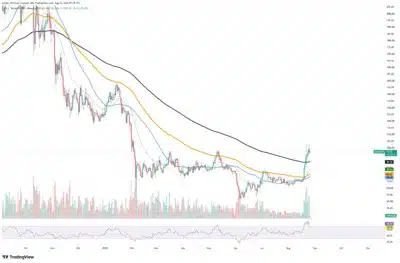
The cryptocurrency has gained about 27% over the past 30 days and roughly 26% over seven days, highlighting the strength of its recent advance. Significantly, SOL moved above its long-term moving average near $89.50, which represents the most important technical achievement from the recent recovery.
Also Read: RockawayX Acquires Relayer Capital and Targets $150 Million Crypto Fund
$89 Support Holds Key to Solana’s Next Move
According to the market data, SOL’s Relative Strength Index has climbed to approximately 79, placing the token firmly within overbought territory. Consequently, profit-taking could increase if buying pressure weakens, particularly after SOL advanced from the mid-$70s within a relatively short trading period.
Derivatives data also shows elevated bullish positioning, with Binance’s SOL/USDT long-to-short ratio standing near 2.07 among measured accounts. Top trader ratios have also moved above 2.0, indicating considerably more long exposure than short exposure among those measured positions.
We're back on X.
— 36Crypto (@36Crypto1) August 21, 2026
Our previous account (36crypto2) is currently unavailable while we continue working through the appeal process. In the meantime, this is our new official account. While you are on this page, please support us by sharing and following.
Source: Tradingview
That imbalance creates additional liquidation risks if SOL experiences another sustained decline from its current level near $97. Approximately $17.51 million in SOL positions were liquidated across a 24-hour period, demonstrating the pressure already affecting leveraged traders. Moreover, 12-hour futures flows recorded a net outflow of roughly $60.77 million, which could leave additional leveraged longs vulnerable during another downward move.
Solana’s Bullish Structure Faces a Critical Test
However, SOL has not confirmed a broader bearish reversal because the token remains above its long-term moving average near $89.50. Shorter moving averages remain around $78 and $84, while increased trading volume during the breakout showed stronger participation from buyers.
Therefore, the $89 to $90 region has become more important than the rejected $100 level as Solana attempts to preserve its recovery structure. A sustained hold above $89 could allow SOL to consolidate before buyers make another attempt toward the $100 to $103 range.
Conversely, a daily close below $89 could expose $84 before bringing the $78 to $80 region into consideration. For now, the failed $100 breakout has not ended Solana’s broader recovery, but defending $89 could determine whether buyers retain control of the trend.
Also Read: Ethereum Developers Sound Alarm Over L1 Contract Risks Ahead of Major Gas Overhaul
