- Stellar Lumens shows early recovery signs after recent market decline.
- Traders monitor XLM’s resistance near $0.357 for breakout confirmation.
- Technical indicators hint at stabilization amid cautious market sentiment.
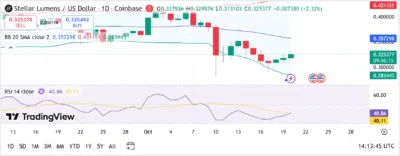
Stellar Lumens (XLM) is displaying early signs of recovery following a prolonged downward trend. The token traded around $0.325, reflecting a 2.3% daily gain and suggesting renewed market activity. According to Coinbase data, XLM briefly reached $0.329 before stabilizing near its current level.
Recent trading sessions show that XLM rebounded from the lower Bollinger Band, a zone that often marks the edge of overselling. Resistance is positioned near $0.357, while support remains at $0.283, creating a narrow trading range. The presence of green candles on the chart indicates that buying interest is gradually returning.
Indicators Point to Price Stabilization
Technical readings show that XLM’s momentum is beginning to even out. The Relative Strength Index (RSI) currently stands at 40, suggesting that the asset is moving closer to neutral conditions after being under selling pressure. The Bollinger Bands are narrowing, a development that often precedes a breakout or extended price consolidation.
Also Read: HMRC Intensifies Crackdown on Unpaid Crypto Taxes as Warning Letters Surge

Source: Tradingview
The 20-day simple moving average continues to hover above the current price, signaling a key resistance zone. Analysts note that a move above this level could confirm a trend reversal if volume supports the shift. Traders are monitoring this technical area closely for any decisive move.
Market Sentiment and Broader Context
Market sentiment around Stellar Lumens remains cautious but steady. Broader market conditions continue to influence its direction, with most altcoins experiencing similar volatility. XLM’s current pattern aligns with gradual recovery efforts seen across other major digital assets.
Trading activity shows restrained participation as investors await clear momentum signals. The overall structure of the chart indicates that the asset is attempting to regain footing after recent declines, with attention focused on whether bulls can sustain pressure beyond the $0.357 resistance zone.
Also Read: Breaking: Ripple Backs Evernorth in $1B Deal to Launch Institutional XRP Vehicle
