- Tezos breaks 7-month trendline—bulls target $1.03 next.
- Smart money flows surge as XTZ reclaims bullish momentum.
- EMA alignment and rising volume confirm breakout strength for Tezos.
Tezos (XTZ) has broken free from a macro downtrend for the first time in seven months, triggering a wave of optimism across the market. With a sharp 21% rally this week, the token is now trading at $0.776 and appears poised to retest the $0.82–$0.85 zone—a historical supply region that has repeatedly rejected bullish attempts in the past.
The breakout is not just symbolic; it is reinforced by a shift in technical structure, volume growth, and a noticeable uptick in smart money accumulation. With a full stack of bullish indicators behind it, Tezos is shaping up as one of the more promising altcoins to watch into the second half of 2025.
Also Read: WisdomTree Highlights XRP’s 20x Potential as It Renames HYIN Fund
Trend Structure and Price Zones
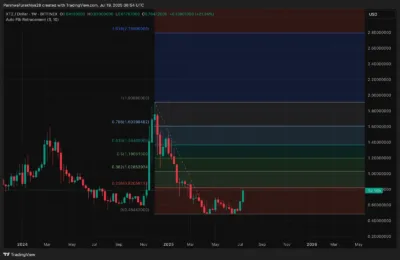
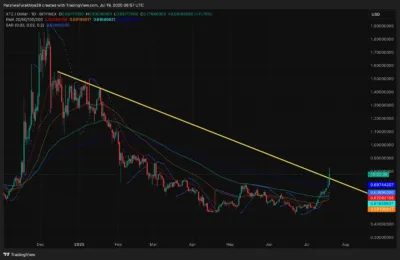
After months of lower highs and lower lows, Tezos has finally confirmed a structural reversal by closing above its long-standing descending trendline, in place since January 2025. The breakout, which was validated by a strong daily candle close above $0.75, marks a significant shift in market structure. Price is now approaching the $0.82–$0.83 zone, which aligns with the 0.236 Fibonacci retracement from the November 2024 high to the March 2025 low.
Should XTZ break cleanly above this range, the next logical target becomes $0.90, followed by the more substantial $1.03 level—the 0.382 Fib mark. On the downside, immediate support rests at $0.717, which represents the recent Supertrend baseline and breakout pivot. A more significant retest could bring price down to $0.68, aligning with the Change of Character (CHoCH) region and prior consolidation support.

Source: Tradingview
Momentum Indicators and Volume
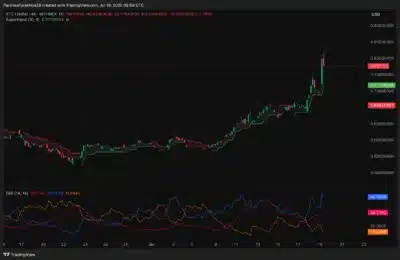
Momentum indicators are currently painting a bullish picture. The 4-hour Relative Strength Index (RSI) remains elevated above 65, reflecting strong buying pressure, while the Directional Movement Index (DMI) shows a +DI of 60.05 versus a -DI of 11.94. A rising ADX further confirms the strength of the developing trend.
Meanwhile, the Parabolic SAR has flipped bullish on the daily chart for the first time since February, and the Supertrend indicator has remained in green territory since the breakout at $0.65. Together, these signals suggest that the recent move is not just a temporary bounce but the beginning of a broader trend reversal.
Exponential Moving Averages (EMAs)
Tezos has achieved a full bullish crossover on its major exponential moving averages. On both the daily and 4-hour timeframes, the 20, 50, 100, and 200 EMAs are now stacked in ascending order beneath the current price. This alignment indicates strong trend support and adds confidence to the breakout’s validity.
Historically, this kind of EMA structure has marked the start of sustained rallies in previous Tezos cycles. For now, as long as XTZ holds above these moving averages, the bullish momentum remains firmly intact.
On-Chain Analysis: Accumulation Strengthens
Supporting the technical breakout is strong on-chain data. On July 19, XTZ registered over $417,000 in net spot inflows—the highest single-day net positive flow in over a month. This surge in capital indicates renewed investor confidence and highlights the role of accumulation in driving the recent price surge.
Smart Money Concepts indicators echo this sentiment. A Change of Character was recorded at $0.68, followed by a Break of Structure at $0.71. With price now pushing above the last equal high (EQH), buyers appear to have taken control after months of seller dominance.
XTZ Price Forecast Table
| Year | Low ($) | Average ($) | High ($) |
| 2025 | 0.68 | 0.93 | 1.20 |
| 2026 | 0.90 | 1.25 | 1.60 |
| 2027 | 1.05 | 1.48 | 1.90 |
| 2028 | 1.20 | 1.75 | 2.10 |
| 2029 | 1.40 | 2.00 | 2.40 |
| 2030 | 1.55 | 2.25 | 2.80 |
Year-by-Year Outlook
2025
This year marks a key turning point for Tezos, as the token aims to secure a position above the $0.82 resistance zone. A daily close above this range could open the path toward $0.90 and even $1.03. However, bulls must hold $0.68 to preserve the uptrend. Failure to defend this level may expose the asset to a deeper pullback.
2026
If bullish sentiment in the broader crypto market sustains, XTZ could attempt to revisit its November 2024 high near $1.20. With continued inflows and network improvements, an extension toward $1.60 becomes plausible.
2027
By 2027, Tezos may challenge the $1.90 mark, especially if broader altcoin momentum returns. A macro recovery and successful rollouts of Tezos-based applications could create a longer-term bottom structure, encouraging institutional involvement.
2028
Should the ecosystem gain adoption or see growth in smart contract deployment, XTZ could move toward $2.10. This would depend on Tezos remaining competitive in scalability and governance upgrades.
2029–2030
Assuming the blockchain industry matures and institutional players begin integrating Tezos into real-world infrastructure, the token could surpass $2.50, potentially pushing as high as $2.80. However, much will depend on execution, competition, and continued network innovation.
Conclusion
Tezos is emerging from a prolonged slump with renewed strength. Its recent breakout above a descending trendline, combined with bullish EMAs, rising volume, and smart money signals, sets the stage for a potential sustained rally. The next key challenge lies at $0.82–$0.85—clearing this zone could accelerate the move toward $1.00 and beyond.
However, traders should remain watchful. A loss of support at $0.68 would invalidate much of the current structure and could return Tezos to its previous consolidation range. For now, though, XTZ bulls appear firmly in control of the trend.
FAQs
1. Is XTZ currently bullish?
Tezos has broken its long-term downtrend, with bullish momentum supported by EMAs, Parabolic SAR, and strong spot inflows.
2. What’s the key resistance zone to watch?
The $0.82–$0.85 area is critical. A successful daily close above it may lead to a move toward $0.90 and $1.03.
3. Where is the strongest support?
Immediate support lies at $0.717, while stronger structural support is found near $0.68.
4. Can XTZ reach $1 again?
A clean break above current resistance levels, supported by volume and trend structure, could push price toward $1.03 in the short-to-mid term.
5. What’s driving the current uptrend?
Tezos is benefiting from a combination of technical breakout, on-chain accumulation, strong trend indicators, and investor re-entry after months of consolidation.
Also Read: Coinbase CEO Says Genius Act Will Replace the Outdated Financial System Forever


