


- Wormhole stages breakout after weeks of downside pressure
- Clean break above $0.088 flips resistance into support
- Bulls now eye $0.102 and beyond as momentum builds
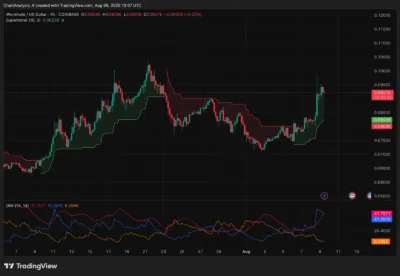
Wormhole (W) has staged an impressive rally, climbing to $0.09216 after breaking out from a multi-week descending trendline that had capped gains since late July. The move cleared the $0.085–$0.088 resistance zone, setting up a possible push toward the $0.100–$0.102 range.
The market structure has turned bullish. All of the major EMAs (20/50/100/200 4-hour chart) are in a bullish position between $0.0857 and $0.0815. This breakout was accompanied by positive levels of DMI ( 41.26 vs -DI 6.29), showing the bulls to be in control despite the not-too-serious expenses throughout the outflows of $1.32 million within the last 24 hours.
Source: Tradingview
Also Read: PEPE (PEPE) Price Prediction 2025–2030: Will PEPE Hit $0.00001550 Soon?
Technical Indicators Support Bullish Outlook
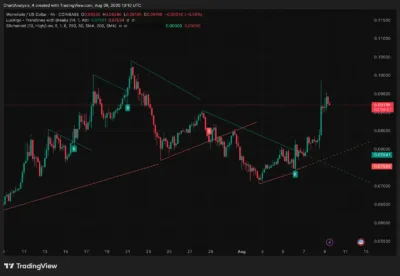
Wormhole trading in the 4-hour chart is holding just beneath the upper Bollinger Band at the level of $0.095, indicating high buying pressure in the recent trade. The Supertrend continues to be bullish above the resistance level of $0.0823, and EMAs are also offering back up between the price levels of $0.085 and $0.081.
Source: Tardingview
We're back on X.
— 36Crypto (@36Crypto1) August 21, 2026
Our previous account (36crypto2) is currently unavailable while we continue working through the appeal process. In the meantime, this is our new official account. While you are on this page, please support us by sharing and following.
The ensuing breakout was of the retest-and-launch pattern on the trendline break-bullish confirmation structure. ADX 41 shows an aged but still powerful trend that might witness short-term breathing breaks prior to the new aggressive correction.
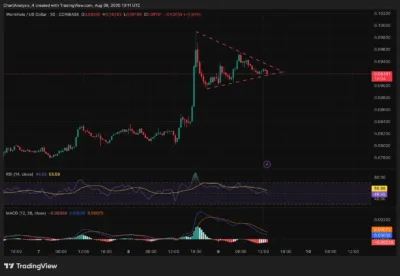
In the 30-minute time frame, the price spirals within a symmetrical triangle. The RSI is neutral at 48.55, and the MACD has flattened, suggesting that the next leg could be in a consolidation stage. This Parabolic SAR is below the price, but the dots are beginning to converge, which indicates that the momentum will change upon losing volume.
Source: Tradingview
The VWAP of almost $0.0927 is at a balance break point between buyers and sellers, and key reference levels of the down mean are at $0.090 levels, $0.085 levels, and $0.082 levels. The bullish invalidation zone is at the price of $0.078, which corresponds to the breakout retest and the 200 EMA.
Resistance Test Could Form 2025 Trend
A move above the resistance level of $0.095 with a high volume would confirm the presence of a run level towards the prices of $0.100-$0.102, followed by $0.105, with the holding of the high levels of July. Sustained closes above $0.102 would prove irresistible, especially to momentum traders, and could put figures like $0.110 within reach.
Failure to hold $0.090 could trigger a pullback to $0.085, then $0.082, with more profound weakness risking a slide to $0.078 — a level that must hold to preserve the bullish.
Wormhole Price Forecast 2025–2030
| Year | Minimum ($) | Average ($) | Maximum ($) |
| 2025 | 0.078 | 0.090 | 0.110 |
| 2026 | 0.082 | 0.095 | 0.125 |
| 2027 | 0.085 | 0.102 | 0.140 |
| 2028 | 0.090 | 0.110 | 0.155 |
| 2029 | 0.095 | 0.120 | 0.170 |
| 2030 | 0.100 | 0.130 | 0.185 |
Year-by-Year Outlook
2025
W is in the early phase of a confirmed breakout, with primary support at $0.085–$0.082. If the price breaks and is sustained above $0.102, then $0.110 becomes a realistic year-end target.
2026
If bullish alignment holds and the $0.095–$0.100 range flips into long-term support, W could average $0.095 and rally to $0.125.
2027–2028
Sustained accumulation and trend continuation could lift W toward $0.140 in 2027 and $0.155 in 2028, provided higher lows above $0.085 are maintained.
2029–2030
With broader market growth and adoption, W may test $0.170 in 2029 and $0.185 in 2030, assuming continued bullish structure and investor participation.
Conclusion
The Wormhole breakout marks a sharp shift from the sideways and bearish action seen since late July. Positive EMA alignment, strong DMI readings, and a successful retest of former resistance have improved the technical landscape.
Holding above $0.085 keeps the bullish setup intact, while a break above $0.102 could spark a run toward $0.110. Traders should watch for volume confirmation and protect against reversals below $0.078.
FAQs
1. Is Wormhole going bullish?
Yes. The trendline breakout, EMA bullish stacking, and strong DMI indicate an early-stage trend reversal.
2. Where is the next significant resistance?
The $0.095–$0.102 zone is the immediate hurdle. Clearing it could open $0.105–$0.110.
3. Where is the best support?
Key supports are $0.090, $0.085, and $0.082. The major bullish invalidation level is $0.078.
4. Will Wormhole hit $0.110 by year-end?
It’s possible if $0.102 is broken with high volume and the price structure holds above $0.085.
5. What is behind Wormhole’s rally?
A multi-week trendline breakout, positive EMA alignment, Supertrend support, bullish DMI, and a retest-launch pattern have fueled the upside momentum.
Also Read: Aerodrome Finance (AFRO) Price Prediction 2025–2029: Can AFRO Hit $1.45 Soon?
