The XDC Network, previously known as the XinFin Network, is a blockchain platform tailored for smart contract development and community engagement. Its native cryptocurrency, XDC, has gained traction due to its hybrid blockchain architecture.
Launched in 2019, the platform ensures efficient, scalable, and cost-effective transactions. It uses a delegated Proof of Stake (DPoS) mechanism, allowing up to 2,000 transactions per second (TPS) with minimal gas fees.
The network’s robust structure is reinforced by node operators who stake 10 million XDC tokens and complete KYC procedures. This structure and its lightweight proof-of-work mechanism enhance security while mitigating spam risks. As XDC’s ecosystem grows, its price potential has become a focal point of interest among traders and analysts.
Also Read: Algorand (ALGO) Price Prediction 2025-2028: Will ALGO Reach $0.50 Soon?
Bollinger Bands Analysis
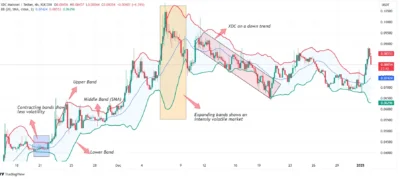
The Bollinger Bands provide insight into key factors affecting XDC’s market, as the token, after testing the upper band, pulled back and now sits below it. This behavior signals a possible correction stage where the tokens seek support at SMA or the lower Bollinger band.
However, this pullback is not a rule out for extending the upper rally as the bull market sentiment gains momentum. The expansion or contraction of Bollinger Bands is often used to predict market volatility.
In light of this, evaluating the recent movement of XDC, I identify a phase that seems to have a period of accumulation before possible enthusiastic actions. Since the token is within the Bollinger Bands range, traders wait closely for a breakout signal.

Source: Tradingview
Relative Strength Index (RSI) Analysis
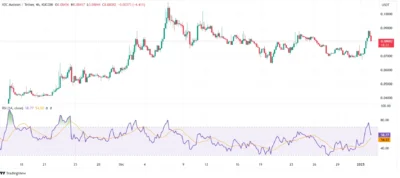
The relative strength index or RSI for XDC now stands at 58, so it can be seen that the token does not fall in the overbought and oversold range. The line’s approach towards SMA may signal a reversal if it goes under this line of average. This could lead to selling pressure, leading to lower prices in the market.
Another way the RSI is used is to identify possible reversing points of the current trend. When the RSI figure is more than 50 but less than 70, buying pressures are persistently intense. On the other hand, going below 50 would mean bearishness, and traders need to pay attention to those levels.

Source: Tradingview
Moving Average Convergence and Divergence (MACD) Analysis
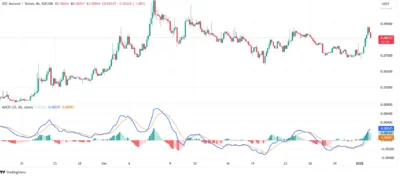
The MACD indicator shows positive momentum for XDC, with a value of 0.00243. The MACD line remains above the MACD-SMA, reflecting better performance than recent averages. However, the MACD line seems to be jumping and may cross the SMA line if market conditions worsen.
This possible merging of the MACD line again to the SMA underscores the need to monitor market trends. Further widening of the hills in the positive region may imply further bullish activities, while flattening these hills may indicate a shift to bearish trends.

Source: Tradingview
XDC Price Predictions Table (2025-2029)
| Year | Minimum Price | Average Price | Maximum Price |
| 2025 | $0.2 | $0.35 | $0.85 |
| 2026 | $0.15 | $0.25 | $0.5 |
| 2027 | $0.45 | $0.75 | $0.9 |
| 2028 | $1 | $1.5 | $2.75 |
| 2029 | $3 | $6.5 | $8 |
Predictions for 2025-2029
2025
XDC could experience a breakout targeting $0.35 after overcoming resistance, but failure to maintain momentum may push it toward the lower trendline.
2026
Following a bull run, XDC may enter a bearish phase with price corrections, potentially trading between $0.15 and $0.5 during this period.
2027
As market sentiment stabilizes, XDC is expected to recover, with consolidation potentially driving the token to an average price of $0.75, reflecting cautious optimism.
2028
The 2028 Bitcoin halving is likely to rekindle enthusiasm across the crypto market, with XDC potentially benefiting and reaching an average price of $1.5.
2029
In 2029, a post-halving bull market may propel XDC to a maximum of $8, signifying strong adoption and market stability.
Conclusion
Currently, the XDC Network remains in the limelight over the effective and self-sufficient type of blockchain platform. Based on the token’s technical parameters, there can be some temporary movement in both directions, as well as long-term trends. Based on the fundamentals and continuously expanding ecosystem, it is possible to note that XDC is capable of meeting large-scale goals by 2029.
FAQs
What is the XDC Network?
The XDC Network is a blockchain platform enabling smart contract development with a focus on scalability and low gas fees.
What does Bollinger Band’s analysis indicate about XDC?
The analysis shows that XDC is in a consolidation phase after testing the upper Bollinger Band.
What is the expected price range for XDC in 2025?
XDC is predicted to trade between $0.2 and $0.85 in 2025, with an average price of $0.35.
How does the MACD indicator reflect XDC’s performance?
The MACD indicates positive momentum, though a potential reversal may occur if the MACD line approaches the SMA.
Could XDC reach $8 by 2029?
XDC is projected to reach $8 by 2029, driven by post-halving market enthusiasm and increased adoption.
Also Read: DeXe (DEXE) Price Prediction 2025-2029: Will DEXE Price Hit $50 Soon?
