


- ChartNerd warns XRP may be forming a historic bear trap that could trigger panic selling.
- The $1.90–$1.93 zone is critical, with $1.90 as key liquidity support and the 20-month EMA (~$1.93) acting as a major trend filter.
- A monthly close above the 20-month EMA would signal a bottom, while a decisive break below it could lead to deeper downside.
Crypto analyst ChartNerd has issued a warning to XRP traders, suggesting that the asset may be setting up what he describes as the biggest bear trap in its history.
According to his analysis, a temporary move below key support levels could mislead market participants into expecting deeper downside, only for the price to reverse sharply afterward. The warning comes as XRP trades near a critical technical zone that has defined multi-month price action.
$1.90 Support Level Under the Spotlight
ChartNerd highlighted the $1.90 region as a major area of liquidity and demand. He noted that if XRP briefly sweeps below this level, it could trigger panic selling and stop-loss cascades, creating the appearance of a bearish breakdown.
However, the analyst argues that such a move may not signal genuine weakness. Instead, it could represent a liquidity grab designed to flush out weak hands before a stronger upside move materializes.
Also Read: Analyst: XRP Is About to Explode Like in 2017, Here’s Why
$XRP: If we sweep into lower liquidity demand pockets and deviate below the $1.90 multi-month support, best believe it will be the BIGGEST bear trap the asset will ever see 🐻
— 🇬🇧 ChartNerd 📊 (@ChartNerdTA) December 15, 2025
20-Month EMA Emerges as a Key Technical Marker
We're back on X.
— 36Crypto (@36Crypto1) August 21, 2026
Our previous account (36crypto2) is currently unavailable while we continue working through the appeal process. In the meantime, this is our new official account. While you are on this page, please support us by sharing and following.
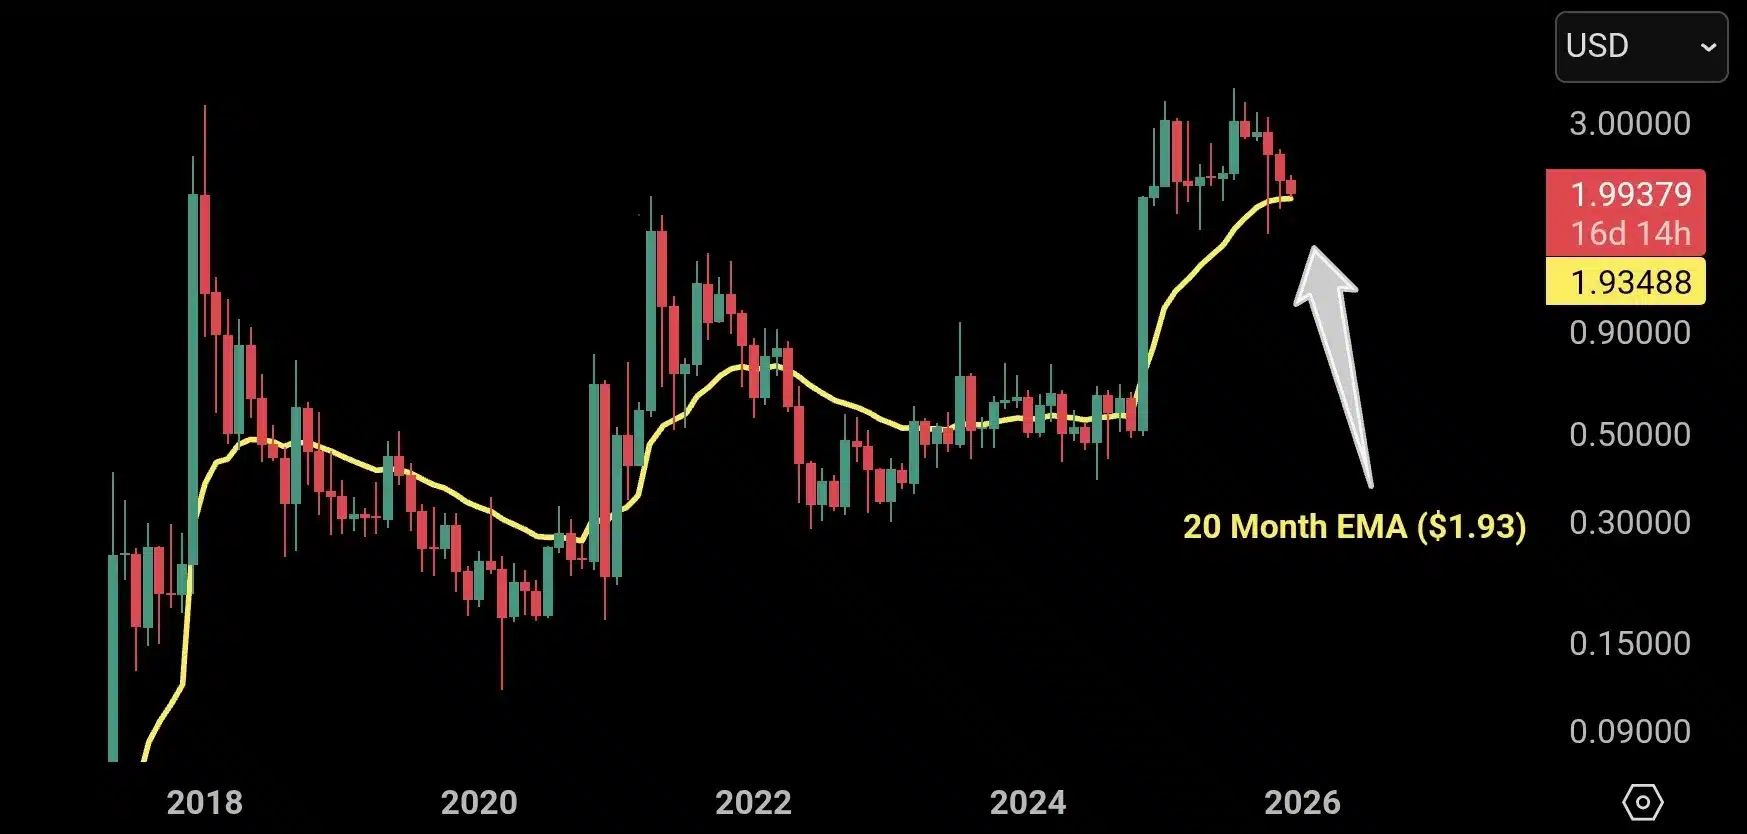
A central focus of ChartNerd’s analysis is the 20-month exponential moving average, currently sitting around $1.93. This level has historically acted as an important trend filter for XRP, separating broader bullish and bearish phases.
According to the analyst, a monthly close above the 20-month EMA in December would likely confirm a local market bottom. Such a close would suggest that XRP is maintaining structural support despite recent volatility.
The accompanying chart shows XRP consolidating just above the 20-month EMA after a strong impulsive move earlier in 2025. Price is currently hovering near this yellow moving average line, with wicks testing lower levels but failing to sustain a breakdown so far.
This behavior supports the idea that buyers are still defending the trend, even as short-term pressure builds. ChartNerd emphasized that December’s monthly close will be decisive in determining whether XRP stabilizes or enters a deeper corrective phase.
Source: ChartNerd/X
Risk of Further Downside Still Remains
While the analyst leans toward a bear trap scenario, he also cautioned that losing the 20-month EMA decisively could open the door to further downside. A sustained close below $1.93 would likely confirm additional market “depression,” potentially pushing XRP into lower demand zones before any recovery attempt.
As the year draws to a close, XRP finds itself at a critical technical crossroads. ChartNerd’s analysis suggests that short-term weakness may be deceptive, with the potential for a sharp reversal if key levels hold.
Whether the market confirms a historic bear trap or signals a deeper correction will largely depend on how XRP closes the month. For now, all eyes remain on the $1.90–$1.93 zone as traders await clarity on the asset’s next major move.
Also Read: Why is XRP Price Crashing Today Despite ETF Inflow Streak?
