


Summary:
- CryptoQuant analyst Arab Chain identified XRP’s three-month volatility low, indicating reduced speculation and a balanced market awaiting stronger participation catalysts.
- Historical volatility cycles show prolonged compression frequently preceded major rallies or corrections, highlighting recurring market behavior patterns.
- Rising derivatives activity, trading volume, and open interest could confirm renewed momentum following extended consolidation across XRP markets.
In the latest XRP news, CryptoQuant analyst Arab Chain reports that XRP’s realized volatility on Binance has dropped to its lowest level in three months, signaling that the market has entered an unusually calm trading phase.
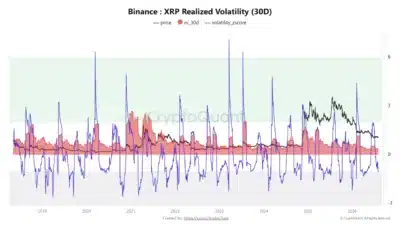
The latest data shows the 30-day realized volatility at approximately 0.34 while XRP changes hands near $1.07. Although the indicator does not predict price direction, analysts widely view prolonged volatility compression as a condition that often precedes stronger market moves.
According to Arab Chain, realized volatility measures how much an asset has actually moved over the previous 30 days rather than the movement traders anticipate. Consequently, the latest reading confirms that XRP has experienced much smaller daily price swings than those recorded during June, when market activity became considerably more active.
Moreover, declining volatility often reflects reduced speculative trading as buyers and sellers reach a temporary balance, leaving XRP within a relatively narrow trading range while participants wait for stronger market catalysts.
Also Read: Circle Secures New York Trust Charter, Strengthening Regulatory Framework for USDC
Historical volatility cycles highlight recurring market patterns
We're back on X.
— 36Crypto (@36Crypto1) August 21, 2026
Our previous account (36crypto2) is currently unavailable while we continue working through the appeal process. In the meantime, this is our new official account. While you are on this page, please support us by sharing and following.
The CryptoQuant chart shows that XRP has repeatedly alternated between periods of low volatility and powerful price expansion over the past several years. Earlier increases in realized volatility coincided with major rallies and corrections, while declining readings accompanied extended consolidation phases.
Additionally, the chart includes a volatility Z-score that compares current conditions with historical volatility levels. The indicator has moved below its long-term average, reinforcing that XRP is trading in a quieter environment than it has during previous months.
According to Arab Chain, low volatility should not be interpreted as either bullish or bearish on its own. Instead, it reflects a market that has temporarily reached equilibrium, with neither buyers nor sellers holding a decisive advantage.
Source: CryptoQuant
Besides, historical market behavior suggests such periods rarely persist indefinitely. Once new catalysts emerge, volatility often expands alongside stronger trading activity and wider price movements.
Furthermore, calmer market conditions allow investors to evaluate XRP’s broader trend without frequent price swings distorting short-term sentiment. That stability also reduces panic-driven trading, creating an environment where participants can assess future opportunities more objectively.
Rising derivatives activity could confirm the next move
Arab Chain also noted that realized volatility becomes more meaningful when combined with derivatives market data. Rising open interest, stronger trading volumes and increased futures participation would provide stronger evidence that momentum is returning to the market.
Likewise, major regulatory developments, ecosystem announcements or broader shifts in investor sentiment could act as catalysts that end the current consolidation phase. Any meaningful increase in market participation would likely influence volatility alongside price action.
Meanwhile, XRP remains near $1.07, reflecting the balance between buyers and sellers identified in the CryptoQuant analysis. Although the current data does not reveal the direction of the next breakout, the prolonged compression suggests traders are closely watching for confirmation through volume and derivatives activity.
Conclusion
XRP is trading in one of its calmest market environments in recent months as Binance’s 30-day realized volatility falls to a three-month low. While the indicator remains neutral regarding price direction, historical market cycles show that extended periods of compressed volatility have often been followed by significantly stronger price activity once trading volume and derivatives participation begin to increase.
Also Read: TRON surpasses 15 billion transactions as network usage outpaces TRX price movement
