

XRP is approaching a critical breakout level as price action continues to tighten within a narrowing range. The asset is now trading near $2.25, showing signs of strength after recovering from a brief dip to $2.21 on June 3.
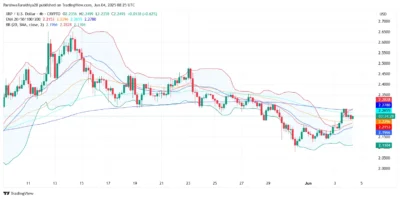
The last 48 hours have seen XRP forming a symmetrical triangle between the support level of $2.22 and the resistance level of $2.28. Both bulls and bears are on standby since the market is forming a symbol of consolidation in lower timeframes. Pressure is slowly growing in the market, and technical indicators show that a breakout might soon happen.
On the 4-hour chart, Bollinger Bands are close together, which suggests less volatility and often precedes a major price movement. Lately, the $2.22 level has withstood testing by buyers, and sellers have been protecting the $2.28 area, so there is an obvious boundary for prices to move either way.
Source: Tradingview
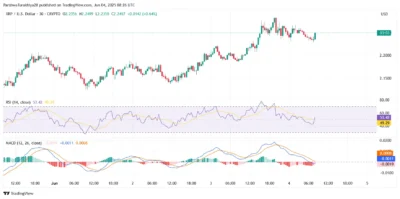
Currently, the short-term picture supports the bulls as the 53.0 level on the 30-minute Relative Strength Index indicates the trend is moving in a bullish direction. Also, the MACD histogram is leveling at zero, making the Ichimoku Cloud base a short-term support zone. With Stoch RSI climbing from oversold levels, buyers are actively trying to take over.
Source: Tradingview
We're back on X.
— 36Crypto (@36Crypto1) August 21, 2026
Our previous account (36crypto2) is currently unavailable while we continue working through the appeal process. In the meantime, this is our new official account. While you are on this page, please support us by sharing and following.
Also Read: XRP Legal Battle Ending? June 13 Rumored as Ripple’s Big Breakthrough
Critical Levels Set the Stage for XRP’s Next Move
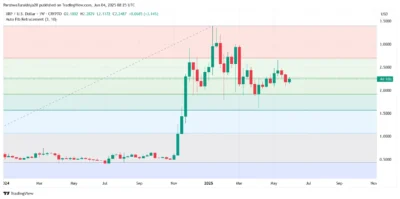
A confirmed breakout above $2.28 would likely trigger a rally toward the next resistance at $2.45. If momentum continues, XRP may revisit the key $2.57 level, which has capped previous upside moves. This zone aligns with the 50 percent Fibonacci retracement level from the broader rally.
A failure to stay above $2.28 or another break below $2.22 might shift the market’s mood. If the first support at $2.20 fails, the next could lie at $2.15 and $2.11, and the decline could continue down to $2.03 or possibly $1.96. The 200 EMA that appears on the 4-hour chart at $2.11 also gives extra significance to that level.
Source: Tradingview
At present, the price of XRP looks like it will soon break out. A range between $2.22 and $2.30 could set in motion the next trend in Bitcoin. Since prices have reached this area, many traders are keeping a close eye on it because a breakthrough could bring a lot of volatility.
Bulls are working hard for a break above $2.30, which XRP is probing at this time. Since volatility is narrowing and key indicators suggest an improvement, investors are now waiting for a big move outside the current range.
Also Read: Here’s What Robinhood’s Bitstamp Acquisition Means For XRP
