

What to Know
- XRP remains trapped between $1.50 to $1.60 resistance and $1.25 to $1.30 support despite positive developments across its ecosystem.
- ChartNerd identifies XRP’s 20-week and 50-week exponential moving averages as critical technical indicators shaping the cryptocurrency’s prolonged price consolidation phase.
- A confirmed breakout above resistance could support gains, while losing support could trigger further declines amid growing investor frustration.
XRP remains confined within a trading range as investors await a decisive move beyond key technical levels. According to crypto analyst ChartNerd, ten weeks of consolidation have kept the cryptocurrency between resistance and support despite positive ecosystem developments.
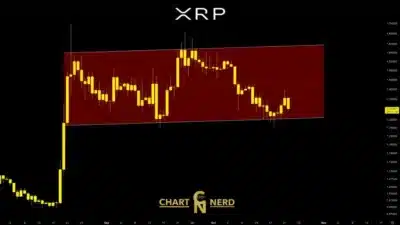
ChartNerd placed resistance between $1.50 and $1.60, with support extending from $1.30 to $1.25. These boundaries have shaped price action and prevented buyers or sellers from establishing sustained control.
The analyst linked the subdued performance to XRP’s technical structure rather than a shortage of ecosystem developments. Before entering this range, XRP recorded a 70% upward move, creating conditions for extended consolidation.
Also Read: NEAR Protocol Price Recovery Hinges on $5.60 Resistance as Momentum Weakens
XRP Weekly Moving Averages Signal Critical Breakout Levels
ChartNerd identified XRP’s 20-week and 50-week exponential moving averages as central features of the current setup. For roughly two months, the cryptocurrency has traded between these indicators while forming a parallel price channel.
We're back on X.
— 36Crypto (@36Crypto1) August 21, 2026
Our previous account (36crypto2) is currently unavailable while we continue working through the appeal process. In the meantime, this is our new official account. While you are on this page, please support us by sharing and following.
The analyst described this arrangement as compression following the earlier rally, with prices repeatedly encountering established boundaries. Resistance around $1.50 to $1.60 remains the upper barrier, while the $1.25 to $1.30 region forms the lower boundary.
Source: X
A confirmed move above resistance would support renewed upward price movement, ChartNerd explained. Alternatively, a breakdown beneath support would indicate further downside, shifting the technical outlook toward lower levels. In both cases, the analyst emphasized confirmation rather than treating brief movements beyond either boundary as decisive signals.
XRP Investors Await Confirmation as Consolidation Persists
ChartNerd also addressed frustration among XRP holders who expected ecosystem announcements to produce stronger market gains. The analyst argued that positive developments and immediate price performance do not necessarily move together during consolidation.
Instead, the current structure places greater importance on how XRP responds when approaching either end of its range. Until a boundary breaks, the analyst expects uneven trading within the established channel.
ChartNerd urged investors to separate social media speculation from the price levels defining the market’s present structure. The analysis identifies two possible outcomes without assigning a confirmed direction to XRP’s next move. A sustained break above resistance or below support would provide the technical confirmation currently missing from XRP’s trading pattern.
Also Read: Chainlink Partners With LG CNS to Expand South Korea’s $68 Billion Crypto Market
