- XRP slides below key support as traders brace for volatility.
- Bollinger Bands reveal growing weakness with $2 level under threat.
- Market pressure mounts as XRP struggles to reclaim lost momentum.
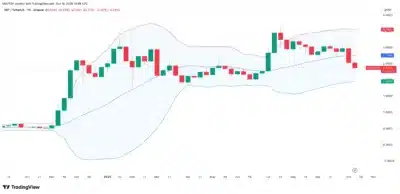
XRP continues to struggle for stability as its price trades around $2.37 after a quick fall to $2.19. Market indicators show growing selling pressure as the token moves below the middle line of its Bollinger Bands and heads toward the lower boundary.
According to market data, XRP has remained under persistent downward momentum, reflecting fading investor confidence. The charts suggest that the token is losing traction across both daily and weekly time frames.
On the weekly chart, the crucial threshold stands near $1.95, which leaves enough room for another decline without entering oversold territory. Hence, even a drop under the $2 level might not immediately attract new buying interest.
Daily candles reveal a similar pattern, with XRP holding close to the lower band at $2.12. The middle line at $2.67 appears distant, and each attempted recovery loses strength before reaching that mark.

Source: Tradingview
Also Read: XRP Holders Urged to Secure Assets as Analyst Issues Critical Warning
$2 Level Emerges as a Key Point of Defense
The $2 price level now plays a critical role for traders and short-term investors. It not only represents a psychological support but also a region where multiple stop losses are concentrated.
A clean break below that range could trigger rapid liquidations, open new short positions, and create additional sell pressure. This scenario highlights the potential for a stronger downside move if buyers fail to intervene soon.
Not long ago, XRP traded comfortably near $3.58 at the upper band, indicating strong bullish momentum. At present, the same indicator positions $1.95 as a fair target if the current trend remains unchanged.
Both the daily and weekly Bollinger Bands point to weakness rather than recovery. Unless XRP’s price reclaims the middle band, the market bias is expected to stay tilted toward sellers.
As a result, the $2 support area remains a crucial line that could determine whether the token stabilizes or faces deeper correction in the coming sessions.
Also Read: Aster (ASTER) Price Prediction 2025–2030: Can ASTER Hit $1.35 Soon?
