


- Aster rebounds from $1.10 support as buyers regain cautious confidence.
- Early inflows hint at accumulation while resistance caps momentum near $1.25.
- Bullish breakout above $1.25 could propel Aster toward $1.35.
Aster trades near $1.16, staging a modest rebound as buyers defend the $1.10 support zone that has underpinned the token’s lower channel since early October. Recent $1.49 million in net inflows suggests cautious accumulation following weeks of steady selling pressure.
Also Read: Chainlink (LINK) Price Prediction 2025–2029: Can LINK Rebound Toward $25?
Market Rebound Hints at Early Stabilization
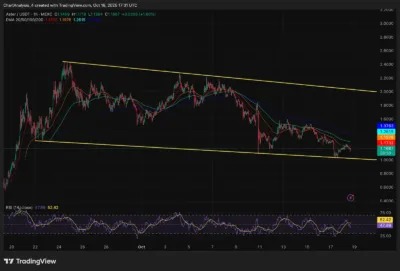
Aster (ASTER) continues to oscillate within a descending channel, repeatedly testing its lower boundary near $1.10. Each dip into this region has sparked short-term buying interest, preventing a deeper breakdown.
However, the 20, 50, 100, and 200 EMAs at $1.17, $1.19, $1.26, and $1.37 form a stacked ceiling that continues to restrain upward movement. The RSI at 52 signals a neutral stance but indicates early signs of rebound momentum.
Aster’s structure will only turn constructive once price closes above $1.25, confirming a short-term breakout from the descending pattern. Failure to do so could expose the $1.10–$1.00 zone once more if sellers regain control.
Source: Tradingview
Technical Structure Signals Early Reversal Attempts
We're back on X.
— 36Crypto (@36Crypto1) August 21, 2026
Our previous account (36crypto2) is currently unavailable while we continue working through the appeal process. In the meantime, this is our new official account. While you are on this page, please support us by sharing and following.
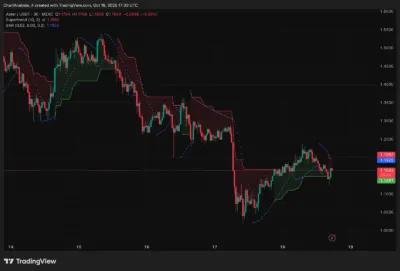
The Supertrend on the 30-minute chart has flipped neutral around $1.19, highlighting indecision after a brief bullish impulse earlier in the session.
The Parabolic SAR dots hover just above price, confirming resistance between $1.18–$1.20, an area that has consistently rejected upside attempts over the past two days.
Bulls must secure a clean breakout above $1.20–$1.25 to shift market sentiment upward. Continued rejection in this zone would maintain a defensive short-term tone, likely driving another rotation back toward $1.12–$1.10 demand levels.
Source: Tradingview
On-Chain Data Shows Modest Accumulation
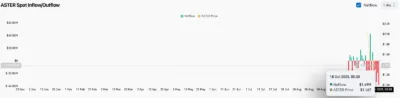
Exchange flow data from Coinglass reveals $1.49 million in net inflows on October 18 the first positive reading after multiple sessions of heavy outflows exceeding $10 million.
This signals a tentative return of liquidity as traders begin positioning near the channel floor. However, analysts caution that sustained daily inflows above $5 million would be required to confirm genuine accumulation and reduce downside risk.
Source: Coinglass
Aster Price Prediction 2025–2030
| Year | Minimum ($) | Average ($) | Maximum ($) |
| 2025 | 1.00 | 1.25 | 1.37 |
| 2026 | 1.10 | 1.35 | 1.50 |
| 2027 | 1.20 | 1.45 | 1.70 |
| 2028 | 1.35 | 1.60 | 1.90 |
| 2029 | 1.50 | 1.75 | 2.10 |
| 2030 | 1.70 | 1.95 | 2.30 |
Year-by-Year Outlook
2025
Aster is expected to trade between $1.00 and $1.37 as buyers attempt to sustain accumulation near the lower channel base. A breakout above $1.25 could mark the start of a structural recovery.
2026
If consistent inflows return and liquidity improves, ASTER may revisit the $1.50 region, validating a mid-term bullish reversal.
2027
Ecosystem development and broader participation could drive price expansion toward $1.70, supported by renewed on-chain activity.
2028
Rising adoption and integration within DeFi environments may strengthen ASTER’s value above $1.90, indicating a maturing growth cycle.
2029–2030
Assuming steady network evolution and sustained inflows, ASTER could stabilize between $1.95 and $2.30, marking a full recovery phase.
Conclusion
Aster’s near-term outlook hinges on whether bulls can defend $1.10 and overcome $1.20–$1.25 resistance. Recent inflows mark an encouraging shift toward accumulation, but confirmation requires sustained liquidity and a breakout above $1.25.
A move past $1.37 (200 EMA) would likely confirm a trend reversal toward higher consolidation zones. For now, ASTER’s tone remains neutral-to-cautiously bullish as technical stabilization continues.
FAQs
1. Why is Aster’s price fluctuating around $1.10–$1.20?
Aster remains within a descending channel where $1.10 acts as key support and $1.20–$1.25 provides short-term resistance.
2. What do the latest inflows indicate?
A $1.49 million net inflow on October 18 marks early accumulation signs after prolonged outflows.
3. What are the major resistance levels to watch?
$1.20, $1.25, and $1.37 (200 EMA) — clearing these could open a path toward $1.35 and beyond.
4. What happens if Aster loses $1.10 support?
A breakdown below $1.10 could send price toward $1.00–$0.95, invalidating the current rebound structure.
5. When will Aster confirm a bullish reversal?
Once price closes above $1.25 with consistent positive inflows above $5 million per day, signaling a momentum shift.
Also Read: Solana (SOL) Price Prediction 2025–2030: Will SOL Break Past $250 After ETF Approval?
