

What to Know
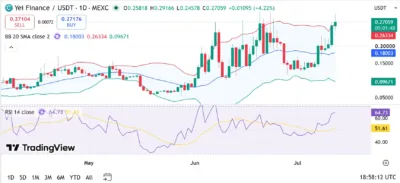
- YEI has broken above the upper Bollinger Band after gaining 4.22%, confirming renewed bullish momentum on the daily chart.
- RSI has climbed to 64.73, reflecting growing buying strength while remaining below the overbought threshold.
- Holding above the upper Bollinger Band near $0.2633 could pave the way for a move toward $0.35 and beyond.
Yei Finance (YEI) has extended its bullish momentum after breaking to fresh multi-week highs on the daily timeframe. The latest chart shows YEI trading around $0.2706, rising from an opening price of $0.2582 to record a 4.22% daily gain. The rally has carried the token above the upper Bollinger Band at $0.2633, while the Relative Strength Index (RSI) has climbed to 64.73, comfortably above its moving average of 51.61.
The breakout follows several weeks of consolidation during which buyers consistently defended higher lows despite periodic pullbacks. With momentum accelerating and technical indicators turning increasingly positive, traders are watching whether YEI can sustain its advance and establish a stronger long-term uptrend.
Bulls Extend Breakout Above Key Resistance
YEI spent much of late June and early July trading within a broad consolidation range after an explosive rally. Although sellers managed to trigger several sharp corrections, each decline attracted fresh buying interest before reaching the 20-day Bollinger Band average.
That accumulation phase appears to have ended with the latest breakout. Price has surged above the upper Bollinger Band, signaling expanding volatility backed by stronger demand. Such moves often reflect increased market participation and renewed investor confidence, particularly when accompanied by improving momentum indicators.
We're back on X.
— 36Crypto (@36Crypto1) August 21, 2026
Our previous account (36crypto2) is currently unavailable while we continue working through the appeal process. In the meantime, this is our new official account. While you are on this page, please support us by sharing and following.
The recent breakout also places YEI near its highest trading levels in weeks. If buyers continue defending gains above the upper Bollinger Band, the current rally could attract additional momentum traders looking for continuation toward higher resistance zones.
Technical Outlook
The technical picture has improved significantly over recent sessions. Trading above both the 20-day Bollinger Band average at $0.1800 and the upper Bollinger Band near $0.2633 confirms that buyers have regained firm control of the short-term trend.
Meanwhile, the RSI reading of 64.73 suggests bullish momentum continues strengthening without yet entering the traditional overbought region above 70. This indicates that buying pressure remains healthy while still leaving room for additional upside if trading volume continues to expand.
The first major resistance sits around $0.30, where previous highs may encourage profit-taking. A decisive breakout above that level could expose the next targets near $0.35 and $0.40. On the downside, the upper Bollinger Band around $0.2633 becomes the first important support. If that level fails, the 20-day moving average near $0.1800 could serve as the next major area where buyers attempt to stabilize price.
Source: Tradingview
Yei Finance (YEI) Price Prediction (2026–2030)
| Year | Minimum | Average | Maximum |
|---|---|---|---|
| 2026 | $0.24 | $0.30 | $0.35 |
| 2027 | $0.28 | $0.36 | $0.42 |
| 2028 | $0.34 | $0.42 | $0.48 |
| 2029 | $0.40 | $0.47 | $0.55 |
| 2030 | $0.45 | $0.52 | $0.60 |
Price Forecast by Year
2026
If YEI maintains support above the upper Bollinger Band and buyers continue defending the breakout, the token could gradually climb toward the $0.35 region.
2027
Increasing trading activity and broader cryptocurrency market strength could help YEI establish itself above previous resistance levels and approach $0.42.
2028
Continued ecosystem development, stronger liquidity, and improving investor confidence may allow YEI to challenge the $0.48 mark.
2029
If the long-term uptrend remains intact, YEI could build sufficient momentum to target the $0.55 region as adoption expands.
2030
Sustained network growth, healthier market conditions, and continued demand could position YEI to challenge the psychological $0.60 milestone before the end of the decade.
Conclusion
Yei Finance is displaying one of its strongest technical structures in recent weeks after breaking above the upper Bollinger Band and maintaining an RSI reading well above its moving average. Those signals suggest buying momentum continues to strengthen while sellers gradually lose control.
The next major challenge remains the $0.30 resistance zone. A successful breakout above that level would reinforce the bullish outlook and improve the probability of reaching higher long-term price targets. Meanwhile, holding above $0.2633 will remain critical for preserving the current recovery.
FAQs
1. Is YEI currently in a bullish trend?
Yes. YEI is trading above both the 20-day Bollinger Band average and the upper Bollinger Band, while the RSI remains above 60, indicating buyers currently have the upper hand.
2. Why is the $0.2633 level important?
The $0.2633 level represents the upper Bollinger Band, which has shifted from resistance to a key support area. Holding above it would strengthen the bullish outlook.
3. What does the RSI reading of 64.73 indicate?
An RSI of 64.73 shows strong buying momentum without entering the overbought zone above 70, suggesting there is still room for additional upside.
4. Can YEI realistically reach $0.50 before 2030?
If YEI maintains its current momentum, expands its ecosystem, and benefits from a favorable crypto market cycle, reaching the $0.50 level before 2030 is a realistic long-term target.
5. What risks could prevent YEI from reaching its price targets?
Market-wide corrections, declining trading volume, loss of key support levels, regulatory uncertainty, or slower ecosystem growth could delay or limit YEI’s long-term price appreciation.
Also Read:
