- SKL surges from early August lows, breaking a multi-month descending trendline and key resistances.
- RSI sits in overbought territory at 72.19, but momentum indicators confirm bullish strength.
- Bollinger Band expansion signals volatility breakout, with EMAs now acting as strong support.
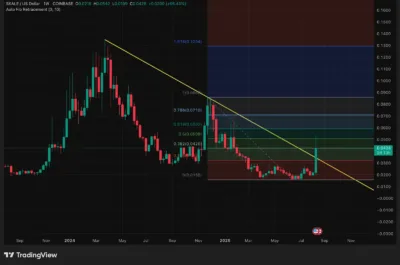
SKALE (SKL) has staged a sharp recovery since early August, emerging from a prolonged period of weakness and reclaiming lost ground. The token has decisively broken a multi-month downtrend and pierced through strong horizontal resistances in the $0.025–$0.030 zone. Currently trading near $0.042 after briefly touching $0.0515, SKL has also managed to breach the 0.5 Fibonacci retracement level at $0.0509, an important milestone that signals a potential shift in market structure.
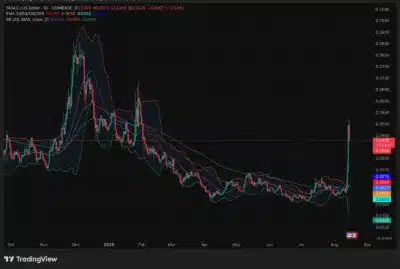
Expanding volatility, a bullish EMA alignment, and strong momentum readings support the rebound. For the first time in months, SKL is trading above all major exponential moving averages (20, 50, 100, and 200), effectively converting these indicators into immediate support levels.
Also Read: OKB (OKB) Price Prediction 2025–2030: Will OKB Hit $130 Soon?
Technical Analysis
Bollinger Bands
The Bollinger Band formation has changed radically over the past few weeks. The bands have widened suddenly after many months of tight compression as the price action of SKL picked up. These expansions are usually the start of trending periods, and volatility erupts following a calm period.
At present, SKL is above the upper Bollinger Band, which is likely to be followed by short-term cooling periods. Nevertheless, price is pushing towards the upper band, evidence of bullish dominance.
The levels of support to monitor are located at $0.0394 and $0.0320 and are backed up by the newly flipped EMAs. On the positive side, a continued close above 0.0509 may open the path to the 0.618 Fib level at 0.0592 in 2025.
RSI Behavior
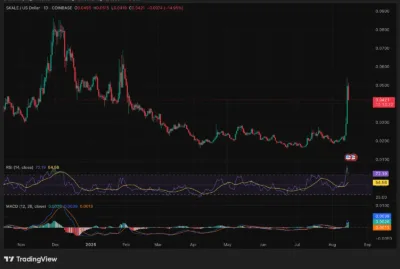
It is overbought as the daily Relative Strength Index (RSI) is 72.19. After months of narrow compression, the bands have expanded sharply as SKL’s price action accelerated. Nevertheless, as long as RSI is above 60, the overall uptrend is still very much in place.
The force of the RSI advance underlines the decisiveness of the shift in sentiment. Buyers have dominated sellers in months of bearish pressure, and this move might have marked the beginning of a protracted bullish cycle.
Support and Resistance
There has been a significant shift in SKL’s technical organization. The 20 EMA ($0.0232), 50 EMA ($0.0237), 100 EMA ($0.0262), and 200 EMA ($0.0270) are all at lower price levels, forming stacked support levels. This convergence is normally indicative of a healthy and building trend.

Source: Tradingview
Resistance is at $0.0509, the critical 0.5 Fib level that has been briefly broken in the last few sessions. A break above this with force would open the next bullish objective at $0.0592 (0.618 Fib). Any consolidation beyond the price of $0.039 would verify bullish dominance and sustain the larger trend higher.

Source: Tradingview
SKALE (SKL) Price Prediction Table (2025–2030)
| Year | Minimum Price | Average Price | Maximum Price |
| 2025 | $0.0250 | $0.0450 | $0.0590 |
| 2026 | $0.0280 | $0.0520 | $0.0710 |
| 2027 | $0.0320 | $0.0600 | $0.0860 |
| 2028 | $0.0380 | $0.0720 | $0.1080 |
| 2029 | $0.0450 | $0.0900 | $0.1180 |
| 2030 | $0.0520 | $0.1050 | $0.1290 |
Year-by-Year Price Breakdown
2025
If SKL consolidates above $0.039, bulls could aim for $0.0592 (0.618 Fib). Key supports lie at $0.0394 and $0.0320, which must hold to protect the uptrend.
2026
Maintaining above $0.045 would enable SKL to drive towards the $0.786 Fib retracement of $0.0710. Any decline below $0.028 might dent the process, but the wider breakout formation would remain intact.
2027
As network adoption advances, SKL could reach $0.086. Sideways accumulation over an extended period between $0.060 and $0.070 would most probably be followed by the breakout that releases this target.
2028
If there is further momentum, SKL can test the level of $0.108. However, it will be important to keep the price propped up at $0.072 to preserve the integrity of the long-term trend.
2029
During a healthy market cycle, SKL may reach as high as $0.118, which is the price in extended Fibonacci calculations and historical cycle rallies.
2030
SKL’s bullish scenario implies highs of up to around $0.129 or a complete 1.618 Fib extension of the breakout zone by 2030. Support at $0.105 is good and may act as the long-term floor.
Conclusion
SKALE’s breakout above multi-month resistance has dramatically improved its technical outlook. With RSI showing strong momentum, MACD confirming bullish alignment, and all four EMAs stacked in favor of buyers, the near-term and long-term structures appear constructive.
Though short-term pullbacks are possible given overbought conditions, SKL’s ability to hold above $0.039–$0.045 will be key in determining whether the rally sustains. As long as these levels remain intact, the token has a clear technical path toward $0.129 by 2030.
FAQs
1. Why did SKL surge in August?
A decisive move above multi-month resistance, strong buying momentum, and a flip of all major EMAs into support drove the breakout.
2. Is SKL overbought right now?
Yes. With the RSI at 72.19, SKL is technically overbought, suggesting possible short-term pullbacks.
3. What are the critical support levels?
Immediate supports lie at $0.0394 and $0.0320, reinforced by the 20 EMA ($0.0232), 50 EMA ($0.0237), 100 EMA ($0.0262), and 200 EMA ($0.0270).
4. What confirms ongoing bullish momentum?
The MACD bullish cross, widening histogram, and positive EMA alignment all point to sustained accumulation pressure.
5. What upside targets are in play?
Near-term: $0.0509 (0.5 Fib) and $0.0592 (0.618 Fib). Long-term: $0.0710 (2026), $0.086 (2027), $0.108 (2028), $0.118 (2029), and $0.129 (2030).
Also Read: Memecoin (MEME) Price Prediction 2025–2030: Will Memecoin (MEME) Hit $0.00385 Soon?

