

- ARB rallies from $0.45 accumulation zone, breaking out above $0.50 into a rising parallel channel.
- RSI cools to 55.3 after an overbought spike, indicating room for consolidation before another move.
- Supertrend flips bullish at $0.51, with Fibonacci targets pointing to $0.74 and $0.85.
Arbitrum (ARB) has bounced back after weeks of being pushed down, re-taking critical technical levels and flipping market sentiment to its advantage. Having briefly reached the value of $0.61, the token is currently trading at around $0.588 and must now pass the crucial psychological barrier of $0.60, which will determine whether the momentum will continue to higher Fibonacci levels.
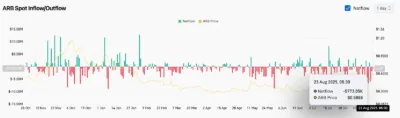
The on-chain activity is moderate with moderate exchange outflows of $0.77 million, indicating that accumulation pressure exists. In combination with the technical reversals, ARB is now poised to achieve potential medium-term gains even though it might experience short-term volatility.
Source: Coinglass
Also Read: Pump.fun (PUMP) Price Prediction for August 24, 2025
RSI Behavior
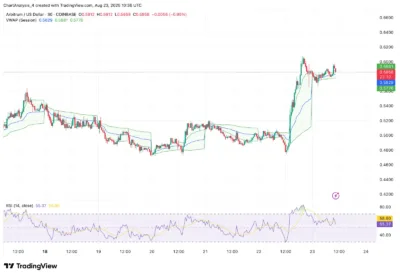
The 30-minute RSI has now settled to 55.3, down from highs above 70 when ARB first raced past 0.50. This indicates that there is a consolidation; however, RSI levels are neutral-to-bullish as long as they are above 50.
A break above 60 once again would indicate that buyers are once again in control. On the other hand, declines to 45-50 may be followed by a test of the support at $0.55.
We're back on X.
— 36Crypto (@36Crypto1) August 21, 2026
Our previous account (36crypto2) is currently unavailable while we continue working through the appeal process. In the meantime, this is our new official account. While you are on this page, please support us by sharing and following.
Source: Tradingview
Supertrend and DMI
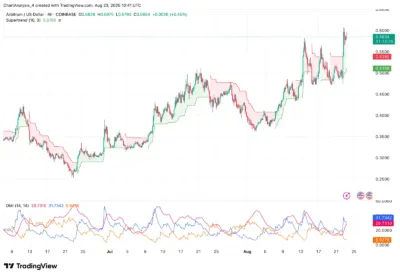
The Supertrend indicator on the 4-hour timeframe has turned bullish and is resting at around $0.51, creating a firm support cluster with the base of the rising channel. This level has become a make-or-break point to be held by the bulls.
Simultaneously, the DMI displays the +DI line above the -DI, and the ADX is growing. This reinforces the existing uptrend and the bullish pattern.
Source: Tradingview
Fibonacci Levels
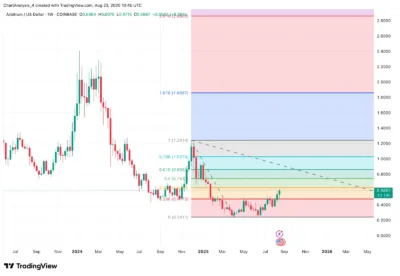
Arbitrum has re-taken the $0.382 retracement at $0.56, which is an essential technical milestone. The next challenge is the $0.5 retracement at $0.74, which represents the medium-term upside target.
In the event of momentum continuation, ARB has the potential to rise to $0.85, the next bullish milestone. A breach of the support at the $0.50 price point, however, would invalidate this pattern and turn the picture bearish.
Source: Tradingview
Support and Resistance
Resistance levels currently stand at $0.60, followed by $0.65–$0.70. These areas should be cleaned up so that ARB can gain upward momentum and reach $0.74.
The bullish breakout has support at $0.55, $0.51, and $0.50 as the invalidation points. A breakdown of these areas would see the price retrace back to the $0.45 accumulation base.
Arbitrum (ARB) Price Prediction Table (2025–2030)
| Year | Minimum Price | Average Price | Maximum Price |
| 2025 | $0.45 | $0.60 | $0.74 |
| 2026 | $0.51 | $0.70 | $0.85 |
| 2027 | $0.58 | $0.78 | $1.05 |
| 2028 | $0.65 | $0.92 | $1.28 |
| 2029 | $0.72 | $1.08 | $1.42 |
| 2030 | $0.85 | $1.25 | $1.60 |
Year-by-Year Price Breakdown
2025
If ARB consolidates above $0.60, bulls could aim for $0.74, the 0.5 Fibonacci retracement. Support at $0.55 and $0.51 must hold to preserve the breakout.
2026
A break above $0.70 would give ARB scope to test $0.85. A drop below 0.51 would not completely kill the bullish trend, but it would weaken it.
2027
By 2027, ARB may be driven to the price of $1.05, passing the $1.00 mark. This breakout is likely preceded by sideways consolidation between $0.78 and $0.90.
2028
Further momentum may take ARB to 1.28. The long-term structure integrity is based on keeping the support in the range of $0.92.
2029
In a healthy cycle, ARB could reach $1.42. This conforms to long-term Fibonacci extrapolations and past rally patterns.
2030
A long-term bullish scenario estimates that $1.60 will be reached by 2030. In this scenario, an ideal support base of $1.25 would act as the floor.
Conclusion
The breakout of Arbitrum above the $0.45 base has changed its technical aspect. ARB is in a good position with bullish Supertrend orientation, reinforced DMI indicators, and vital Fibonacci levels recovered, and it is likely to continue rising.
Near-term corrections can occur at the $0.60 mark, but as long as the asset remains above the $0.51 level, the path is toward the $0.74 and $0.85 levels. At the current rate of adoption, by 2030, ARB can achieve $1.60, a good long-term extension of the cycle.
FAQs
1. Why did ARB surge in August?
The breakout above $0.50, coupled with accumulation flows and bullish technical signals, triggered a rally.
2. Is ARB overbought right now?
No. RSI has cooled to 55.3 after being overbought, suggesting consolidation rather than exhaustion.
3. What are the critical support levels?
Support lies at $0.55 and $0.51, with $0.50 as the invalidation level.
4. What confirms ongoing bullish momentum?
The Supertrend bullish flip, rising ADX in the DMI, and Fibonacci reclaim at $0.56 confirm strength.
5. What upside targets are in play?
The near-term targets are $0.65–$0.74, with $0.85 projected for 2026. The long-term projections extend to $1.60 by 2030.
Also Read: Virtuals Protocol (VIRTUAL) Price Prediction 2025–2029: Can VIRTUAL Hit $5.00?
