

What to Know
- HDX has rallied to the upper Bollinger Band, reflecting strong bullish momentum following a sustained multi-week breakout.
- RSI has climbed above 70, indicating buyers remain in control, although overbought conditions increase the likelihood of short-term pullbacks.
- Holding above the middle Bollinger Band could strengthen HDX’s long-term outlook and support a gradual advance toward higher price targets.
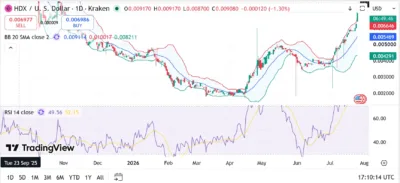
HDX has extended its bullish momentum after breaking out of a prolonged consolidation phase on the daily chart. TradingView data shows the token trading near $0.00908, with price climbing sharply toward the upper Bollinger Band after several consecutive weeks of higher highs and higher lows. Meanwhile, the Relative Strength Index (RSI) has pushed above the 70 level, highlighting strong buying pressure as market sentiment continues improving.
The latest rally follows several months of sideways trading and gradual accumulation. Buyers have consistently defended higher support levels throughout July, allowing HDX to build momentum and approach its highest price levels in months. While the trend remains bullish, the rapid advance also raises the possibility of temporary profit-taking before the next major move.
Also Read: Useless Coin (USELESS) Price Prediction 2026–2030: Can USELESS Hit $0.10 Soon?
Bulls Maintain Strong Momentum
HDX spent much of the previous months trading within a narrow range after an extended decline that began late last year. That consolidation now appears to have transitioned into a bullish breakout as buyers successfully reclaimed the middle Bollinger Band and continued pushing toward the upper volatility boundary.
We're back on X.
— 36Crypto (@36Crypto1) August 21, 2026
Our previous account (36crypto2) is currently unavailable while we continue working through the appeal process. In the meantime, this is our new official account. While you are on this page, please support us by sharing and following.
The middle Bollinger Band currently sits near $0.00547, while the lower band remains around $0.00429. Price trading comfortably above both levels signals that buyers currently control the broader trend. The upper Bollinger Band near $0.01002 now represents the immediate resistance that traders will closely monitor.
The widening Bollinger Bands also indicate rising volatility. Similar technical setups have historically preceded larger directional moves, suggesting HDX could remain highly active over the coming sessions.
Technical Outlook
The RSI has climbed above the 70 threshold, placing HDX in overbought territory. Although this reflects strong bullish momentum, it also suggests that short-term corrections or consolidation periods could emerge as traders lock in profits.
Despite the elevated RSI, the overall technical structure remains constructive. The token continues printing higher highs while remaining well above the 20-day moving average embedded within the Bollinger Bands. As long as price holds above the middle band, the broader recovery trend remains intact.
A decisive breakout above $0.0100 could open the door for another leg higher, while failure to hold recent gains may trigger a pullback toward the middle Bollinger Band, where buyers would likely attempt to establish fresh support before another advance.
Source: Tradingview
HDX Price Prediction (2026–2030)
| Year | Minimum | Average | Maximum |
|---|---|---|---|
| 2026 | $0.0075 | $0.0105 | $0.0135 |
| 2027 | $0.0095 | $0.0135 | $0.0170 |
| 2028 | $0.0115 | $0.0165 | $0.0205 |
| 2029 | $0.0140 | $0.0195 | $0.0245 |
| 2030 | $0.0175 | $0.0240 | $0.0300 |
Price Forecast by Year
2026
If HDX maintains support above the middle Bollinger Band and buyers sustain the current breakout, the token could finish the year trading between $0.0105 and $0.0135.
2027
Growing market participation and improving liquidity could allow HDX to challenge the $0.0170 resistance level if bullish sentiment persists.
2028
A stronger cryptocurrency market cycle and continued ecosystem development may help HDX climb toward $0.0205, surpassing the psychological $0.020 level.
2029
If long-term accumulation continues and demand strengthens, HDX could extend its recovery toward $0.0245 while establishing new higher trading ranges.
2030
Continued adoption together with favorable market conditions could support a move toward $0.0300, representing the strongest long-term upside scenario in this forecast.
Conclusion
HDX is displaying one of its strongest technical structures in recent months after breaking above key Bollinger Band levels and sustaining higher highs throughout July. The expanding Bollinger Bands and elevated RSI confirm that bullish momentum remains dominant, although short-term volatility should be expected following the sharp rally.
Maintaining support above the middle Bollinger Band will remain critical for preserving the current uptrend. A successful breakout above the upper Bollinger Band could strengthen the long-term outlook, while losing key support may trigger a healthy correction before buyers attempt another advance.
FAQs
1. Is HDX currently bullish?
Yes. HDX is trading above the middle Bollinger Band while approaching the upper band, indicating buyers currently control the prevailing trend.
2. Why is the RSI above 70 significant?
An RSI above 70 reflects strong buying momentum but also signals overbought conditions, increasing the possibility of short-term pullbacks.
3. What are the major resistance levels?
The immediate resistance is near the upper Bollinger Band around $0.0100, with a breakout potentially opening the path toward higher price targets.
4. Can HDX reach $0.020?
If the current uptrend continues and broader cryptocurrency market conditions remain favorable, HDX could approach $0.020 during the 2028 forecast period.
5. What risks could limit HDX’s upside?
A failure to hold above the middle Bollinger Band, declining trading volume, profit-taking after the recent rally, and broader cryptocurrency market weakness could slow the current recovery.
Also Read: XRP Price Prediction 2026–2030: Can XRP Hit $3.50 Soon?
