


What to Know
- XRP continues holding above the critical weekly Fair Value Gap between $1.05 and $1.10, preserving the broader recovery structure.
- Spot XRP ETFs have recorded two consecutive weeks of net inflows, pushing total assets under management to nearly $1 billion.
- A recovery above the 20-day EMA and sustained institutional demand could strengthen XRP’s long-term outlook through 2030.
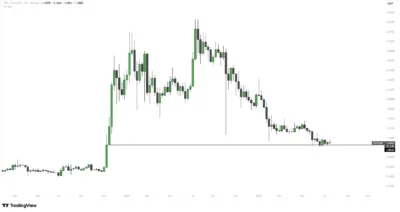
XRP continues trading around $1.09 after several weeks of consolidation above one of its most important technical support zones. TradingView data shows the cryptocurrency compressing directly above the weekly Fair Value Gap (FVG) between $1.05 and $1.10, an area that has consistently supported buyers since the November 2024 rally.
The latest technical indicators suggest XRP is approaching another decisive move. While short-term momentum remains subdued, institutional interest continues improving as spot XRP exchange-traded funds (ETFs) recorded another week of positive inflows, bringing total assets under management close to the $1 billion milestone.
Also Read: Bitcoin (BTC) Price Prediction 2026–2030: Can BTC Hit $67,000 Before August?
Weekly Support Continues Defending The Recovery
The weekly chart remains constructive despite XRP spending several weeks moving sideways. Price continues respecting the Fair Value Gap created during the November 2024 breakout, with buyers repeatedly defending the upper portion of the zone without allowing a weekly close below support.
We're back on X.
— 36Crypto (@36Crypto1) August 21, 2026
Our previous account (36crypto2) is currently unavailable while we continue working through the appeal process. In the meantime, this is our new official account. While you are on this page, please support us by sharing and following.
This prolonged consolidation suggests that market participants continue accumulating positions rather than abandoning them. As long as XRP remains above $1.05, the broader recovery structure remains technically intact.
Source: Tradingview
Another encouraging factor is the repeated rejection of deeper corrections despite periods of declining trading activity. This behavior often reflects growing confidence among longer-term investors willing to hold positions through temporary weakness.
Short-Term Technical Indicators Point Toward A Larger Move
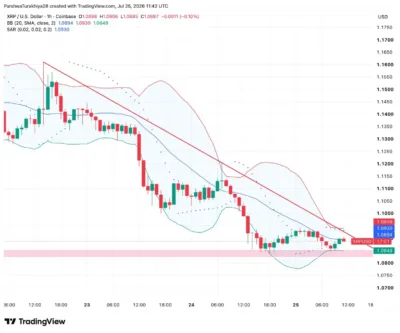
The hourly chart presents a market caught between support and resistance. XRP currently trades near the lower Bollinger Band around $1.0849, while the Bollinger Band midline sits near $1.0894 and the upper band remains close to $1.0939.
Meanwhile, the hourly Parabolic SAR continues printing above price around $1.0930, indicating sellers still maintain short-term control. However, the Bollinger Bands have started tightening considerably, a pattern frequently associated with significant volatility expansion.
The descending trendline from the July 22 high near $1.16 continues limiting upside attempts. A breakout above this resistance would likely improve sentiment and increase the probability of another move toward higher resistance levels.
ETF Inflows Continue Supporting Market Confidence
Institutional participation remains one of XRP’s strongest bullish catalysts. According to SoSovalue, XRP ETFs attracted $8.15 million in weekly net inflows following the previous week’s $6.78 million, extending positive momentum for a second consecutive week. Total ETF assets now stand at approximately $997.25 million, placing the products just below the important $1 billion threshold.
Consistent ETF inflows demonstrate that institutional investors continue allocating capital despite XRP’s relatively narrow trading range. Sustained demand from these investment products could provide additional support if broader cryptocurrency market conditions improve.
Derivatives Market Shows Reduced Selling Pressure
Recent derivatives data indicates traders have become increasingly cautious rather than aggressively bearish. Trading volume declined by 26%, while open interest also eased slightly, suggesting fewer leveraged positions entering the market during the weekend.
Long liquidations totaled approximately $3.60 million, compared with only $136,220 in short liquidations. This imbalance indicates the recent decline primarily removed leveraged bullish positions instead of triggering widespread bearish positioning.
At the same time, Binance’s top traders continue maintaining a 3.14 long-to-short account ratio, suggesting experienced participants still expect higher prices over the medium term.
Technical Outlook
Several technical levels will determine XRP’s next major move. Immediate support remains near $1.0849, while the stronger structural support continues between $1.05 and $1.00. Maintaining these levels would preserve the broader bullish structure.
On the upside, XRP first needs to reclaim the hourly resistance near $1.0939, followed by the daily 20-day EMA around $1.1093. A successful recovery above these levels could shift attention toward the 50-day EMA near $1.1426, with additional upside extending toward the 0.618 Fibonacci retracement around $1.1822. Legislative developments surrounding the CLARITY Act could also influence investor sentiment if regulatory progress materializes before the Senate recess.
Source: Tradingview
XRP Price Prediction (2026–2030)
| Year | Minimum | Average | Maximum |
|---|---|---|---|
| 2026 | $1.20 | $1.65 | $2.10 |
| 2027 | $1.55 | $2.20 | $2.90 |
| 2028 | $1.90 | $2.75 | $3.50 |
| 2029 | $2.30 | $3.30 | $4.40 |
| 2030 | $2.80 | $4.00 | $5.20 |
Price Forecast by Year
2026
If XRP maintains support above the weekly Fair Value Gap while ETF inflows remain positive, the cryptocurrency could gradually recover toward $2.10 as institutional demand strengthens.
2027
Improving regulatory clarity, broader cryptocurrency market expansion, and continued institutional participation could help XRP challenge the $2.90 region.
2028
A stronger crypto market cycle combined with expanding adoption of XRP-based financial infrastructure may allow the asset to revisit $3.50, matching previous major resistance.
2029
Growing liquidity, sustained ETF demand, and increased cross-border payment adoption could support an advance toward $4.40 if long-term momentum remains favorable.
2030
Should XRP continue attracting institutional investment while maintaining broader market leadership, the cryptocurrency could target approximately $5.20, marking a significant extension of its long-term recovery.
Conclusion
XRP remains technically well-positioned as it continues defending the weekly Fair Value Gap that has supported the entire recovery. Although short-term momentum remains constrained beneath nearby resistance levels, consecutive weeks of ETF inflows and resilient institutional positioning provide encouraging signals for the broader outlook.
The coming months will likely depend on XRP’s ability to reclaim higher moving averages while maintaining support above $1.05. Continued institutional accumulation, improving regulatory clarity, and stronger cryptocurrency market conditions could provide the foundation for a gradual advance toward higher price targets through 2030.
FAQs
1. Why is the $1.05-$1.10 Fair Value Gap important?
This weekly Fair Value Gap has repeatedly acted as strong support, making it one of the most important technical zones sustaining XRP’s broader recovery.
2. Why are XRP ETF inflows significant?
Consistent ETF inflows indicate growing institutional demand, which can provide long-term price support even during periods of sideways trading.
3. What resistance levels should traders monitor?
The immediate resistance levels include $1.0939, $1.1093, and $1.1426, with stronger bullish momentum expected above those areas.
4. Can XRP reach $3.50 again?
If institutional demand continues growing, regulatory developments remain favorable, and the broader crypto market strengthens, XRP could revisit $3.50 during the 2028 timeframe.
5. What could weaken XRP’s bullish outlook?
A sustained weekly close below the $1.05 support zone, weakening ETF demand, declining institutional participation, or unfavorable regulatory developments could delay XRP’s long-term recovery.
Also Read: Yei Finance (YEI) Price Prediction 2026–2030: Can YEI Hit $0.50 Soon?
