


What to know
- Shiba Inu formed a mini golden cross, strengthening short-term momentum while approaching major resistance near its 200-day moving average barrier.
- Buyers must defend support between $0.00000446 and $0.00000448 because losing it invalidates the bullish crossover signal completely for SHIB traders.
- SHIB outperformed its historical August performance, posting gains while three technical scenarios outline potential price paths.
Shiba Inu has formed a mini golden cross on its daily chart, placing the token back on traders’ watchlists as it approaches a critical technical barrier. According to TradingView data, the 23-day moving average crossed above the 50-day moving average, signaling that short-term buying momentum has strengthened following an extended period of selling pressure.
The crossover has developed while SHIB trades around the $0.000005 level, where trading activity has remained concentrated. Consequently, investors are monitoring whether buyers can build enough momentum to extend the recovery beyond nearby resistance.
Despite the encouraging signal, analysts note that the broader trend has not yet turned bullish. Price must still overcome several technical hurdles before a stronger recovery can be confirmed. Moreover, trading volume will likely play an important role in determining whether the latest breakout attempt gains traction.
Also Read: XRP Wave 3 Outlook Gains Attention as Analyst Points to Bullish Divergence
Key resistance will determine SHIB’s next move
According to the chart, the most significant resistance sits between $0.00000503 and $0.00000518, where the 200-day exponential moving average continues to cap upward movement. A decisive move above that range would strengthen the bullish structure and improve market confidence.
We're back on X.
— 36Crypto (@36Crypto1) August 21, 2026
Our previous account (36crypto2) is currently unavailable while we continue working through the appeal process. In the meantime, this is our new official account. While you are on this page, please support us by sharing and following.
However, buyers must also defend the support zone between $0.00000446 and $0.00000448. Holding that area would keep the mini golden cross intact and preserve the recent shift in momentum.
Conversely, losing that support would invalidate the bullish crossover and increase the likelihood of another move toward lower price levels. Therefore, traders are paying close attention to both support and resistance before taking stronger directional positions.
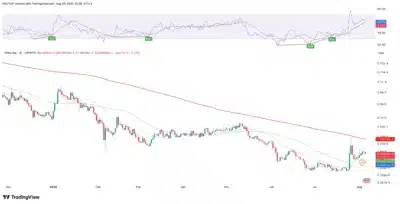
Source: Tradingview
Additionally, SHIB’s recent performance has stood out against its historical seasonal pattern. Instead of recording its average August decline of roughly 0.55%, the token has gained approximately 4.11%, breaking from its typical market behavior during the month.
That strength has also lifted third-quarter performance. According to the market analysis, SHIB has produced a quarterly gain of about 16.7%, exceeding its historical average by a wide margin despite June’s steep correction.
Three possible outcomes emerge from current setup
According to the technical outlook, SHIB faces three possible scenarios if current market conditions persist. In the bullish case, stronger buying volume could push the token above $0.00000518 and open the path toward testing the 200-day moving average. That outcome would strengthen the technical structure heading into the fourth quarter, which has historically delivered SHIB’s strongest average returns.
Alternatively, buyers may keep the token trading between $0.0000045 and $0.0000050 while volatility gradually declines. Such a move would preserve the bullish crossover without confirming a broader breakout. Meanwhile, renewed selling pressure could drive SHIB below the $0.00000446 support level. A breakdown beneath that zone would invalidate the mini golden cross and shift momentum back in favor of sellers.
Conclusion
Shiba Inu’s mini golden cross has improved the token’s short-term technical outlook, but the signal still requires confirmation. A sustained move above major resistance while maintaining key support would strengthen the bullish case, whereas a loss of support would leave the recent crossover as a failed recovery attempt.
Also Read: XRP News: XRP Enters Low-Volatility Phase as Binance Data Signals Market Awaits Next Major Move
