


What to Know
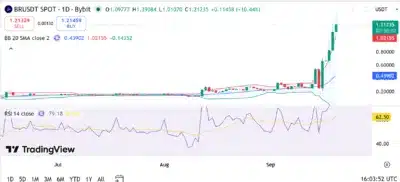
- Bedrock trades at $1.21235 after gaining 10.44%, extending its powerful breakout while remaining above the upper Bollinger Band resistance level.
- RSI has climbed to 79.18, confirming strong buying momentum but warning that BR has entered technically overbought market conditions already.
- Holding $1.02 could support advances toward $1.39 and $1.50, whereas losing that level may trigger a deeper price correction phase.
Bedrock (BR) has extended its remarkable bullish breakout, rising 10.44% to $1.21235 as buyers maintained control following a rapid advance from the September consolidation range. The daily chart shows BR trading above the upper Bollinger Band, highlighting exceptional momentum while simultaneously raising the probability of short-term volatility.
TradingView data places the Bollinger Band midpoint at $0.43902, considerably below the current market price, while the upper band stands at $1.02155. BR opened the session at $1.09777, reached $1.39084, and briefly declined to $1.01070 before recovering above $1.21.
Meanwhile, the Relative Strength Index stands at 79.18, substantially above its moving average of 62.50. This reading confirms aggressive demand but also places BR inside overbought territory, where profit-taking could emerge if buyers fail to sustain the breakout.
Also Read: HIVE Digital Technologies (HIVE) Stock Price Prediction 2026–2030: Can HIVE Hit $15 Soon?
Buyers Push BR Beyond Its Upper Bollinger Band
BR’s move above $1.02155 gives buyers an important technical advantage because the upper Bollinger Band previously represented dynamic resistance. Preserving this level as support would strengthen the breakout structure and potentially attract further buying activity.
We're back on X.
— 36Crypto (@36Crypto1) August 21, 2026
Our previous account (36crypto2) is currently unavailable while we continue working through the appeal process. In the meantime, this is our new official account. While you are on this page, please support us by sharing and following.
However, the long upper wick extending toward $1.39084 shows that sellers became active near the session high. Consequently, the region between $1.30 and $1.39 represents the immediate supply zone that buyers must overcome before challenging the psychological $1.50 barrier.
On the downside, losing $1.02155 could encourage traders to secure profits following the steep advance. Initial support may develop around $0.90, while stronger demand could emerge between $0.75 and $0.80, where BR previously accelerated its upward movement.
A deeper decline would bring the $0.60 breakout region into consideration, although the wider bullish structure would remain intact while buyers defend that former resistance area.
Technical Outlook
Momentum strongly favors buyers, although BR’s distance above its Bollinger Band midpoint shows that the rally has become significantly extended. Such separation often reflects strong trend conditions, but it can also precede consolidation as price returns toward its statistical range.
Moreover, the RSI reading of 79.18 stands well above the conventional overbought threshold of 70. While this does not guarantee an immediate reversal, it indicates that pursuing the rally at elevated levels carries increased risk unless trading volume supports another breakout.
A daily close above $1.39 could confirm renewed bullish continuation and open a path toward $1.50, followed by $1.75. Conversely, rejection around the session high may keep BR fluctuating between $1.02 and $1.39 while momentum indicators cool.
Source: Tradingview
Key Resistance and Support Levels
Immediate resistance stands between $1.30 and $1.39, corresponding with the rejection area visible on the daily chart. A decisive close above $1.39 would strengthen the bullish continuation setup and bring $1.50 into view.
Clearing $1.50 could encourage buyers to target $1.75 and the psychological $2.00 level. Nevertheless, the overbought RSI suggests that BR may require consolidation before sustaining another substantial advance.
Conversely, $1.02155 remains the first major support because it matches the upper Bollinger Band. Below that level, traders may monitor $0.90, $0.75, and $0.60, while the midpoint at $0.43902 represents deeper dynamic support.
Can Bedrock Reach $2?
Bedrock could reach $2 if it maintains its higher-low structure and converts the $1.30–$1.39 supply region into support. Such a move would require an increase of approximately 65% from the chart price of $1.21235.
Although the target appears achievable under a bullish scenario, BR must first establish stability above $1.50 without experiencing a major momentum breakdown. Losing $1.02 would delay the projection and increase the probability of a broader correction.
Bedrock Price Prediction (2026–2030)
| Year | Minimum | Average | Maximum |
|---|---|---|---|
| 2026 | $0.60 | $1.20 | $1.80 |
| 2027 | $0.85 | $1.65 | $2.50 |
| 2028 | $1.10 | $2.20 | $3.40 |
| 2029 | $1.50 | $3.00 | $4.50 |
| 2030 | $2.00 | $4.10 | $6.00 |
Price Forecast by Year
2026
BR could trade between $0.60 and $1.80 during 2026, depending on whether buyers preserve the breakout above $1.02. Clearing $1.39 and $1.50 would support an advance toward the upper forecast, while weakening momentum could return the token toward previous breakout zones.
2027
Sustained demand and successful consolidation above $1.00 could help BR reach a maximum price of $2.50 in 2027. The token would need to convert the $1.50 and $2.00 levels into reliable support to strengthen this projection.
2028
Under favorable cryptocurrency market conditions, BR could trade between $1.10 and $3.40. Continued ecosystem growth, stronger liquidity, and a sequence of higher yearly lows would improve the possibility of reaching the maximum forecast.
2029
BR could advance toward $4.50 if buyers preserve the longer-term bullish structure and defend established support levels. However, weaker market participation could keep the token closer to the projected minimum of $1.50.
2030
A sustained bullish scenario could place BR near $6.00 by 2030, while the average projection stands around $4.10. Achieving this valuation would require consistent demand and successful breaks above earlier psychological resistance levels.
Conclusion
Bedrock’s technical structure remains bullish as BR trades at $1.21235 following a 10.44% daily gain, placing the token substantially above the upper Bollinger Band at $1.02155. However, an RSI reading of 79.18 confirms that the rally has entered overbought territory.
A breakout above $1.39084 could support advances toward $1.50 and $2.00, although buyers must maintain sufficient volume to absorb profit-taking. Failure to defend $1.02 could expose $0.90, with deeper weakness potentially returning BR toward the $0.75–$0.80 demand region.
FAQs
1. Is Bedrock currently bullish?
BR has a strongly bullish structure because its price trades above the upper Bollinger Band, although momentum appears overextended.
2. What does BR’s RSI indicate?
The daily RSI of 79.18 indicates powerful buying pressure but also warns that the token is technically overbought.
3. What are BR’s major resistance levels?
Immediate resistance stands near $1.30–$1.39, followed by the psychological levels at $1.50, $1.75, and $2.00.
4. Can Bedrock reach $2?
BR could reach $2 if buyers clear $1.39, preserve support above $1.02, and maintain the broader bullish momentum.
Also Read: IOTA Price Prediction 2026–2030: Can IOTA Hit $0.10 Soon?
